
How to Calculate Overhead Rate: A No-Nonsense Guide
Learn how to calculate overhead rate with our step-by-step guide. We cover formulas, cost-sourcing, and common mistakes for retail, healthcare, and more.
Dan Robin

A lot of jobs look profitable right up until you ask one annoying question.
What did it cost us to do that work?
I've seen this happen with projects that felt like wins. The invoice went out. The client was happy. The team moved on. Then someone sat down with payroll, rent, software bills, admin time, and the other background noise that keeps a business standing, and the margin started shrinking fast.
That’s why how to calculate overhead rate matters. Not because accountants like formulas. Because if you don’t know your overhead rate, you’re pricing with half the picture. You’re guessing. Sometimes you guess high and lose work. Sometimes you guess low and win work that drains the business.
Is This Job Actually Profitable
A manager finishes a job and sees the obvious costs first. Wages. Materials. Maybe delivery. Those are easy.
The trouble starts with everything that kept the business running while that job happened. Office rent. Scheduling software. Insurance. The salary of the person fixing timesheets and chasing approvals. None of that sits neatly on one invoice, but all of it belongs somewhere.
That nagging feeling is usually right. If a job seems profitable only when you ignore the background costs, it probably isn’t as healthy as it looks.
The number that stops the guessing
Overhead rate is the shortcut to clarity. It tells you how much indirect cost sits behind the direct work you can already see.
Once you have it, a few things get easier fast:
Pricing gets calmer. You stop making quotes based on instinct alone.
Profit reviews get sharper. You can tell the difference between a busy month and a good month.
Team conversations improve. When a supervisor says a job took longer than planned, you can measure the actual cost of that delay.
You don’t need perfect accounting theory to do this well. You need a consistent way to include the costs people forget.
I’ve learned that most overhead problems aren’t math problems. They’re honesty problems. We want the clean version of the numbers. Real operations rarely give us that.
If you’re already looking at margins from a broader angle, something like Return of Earnings Calculation is useful because it pushes the same basic discipline. Don’t stop at surface numbers. Follow the money all the way through.
Why this matters more than people admit
When you don’t know your overhead rate, every decision gets fuzzier.
You can’t tell whether a location is expensive or just busy. You can’t tell whether a service line is underpriced or badly run. And you definitely can’t tell whether a manager is controlling costs or just shifting them somewhere harder to see.
That’s why this number matters. It gives you a clean place to stand.
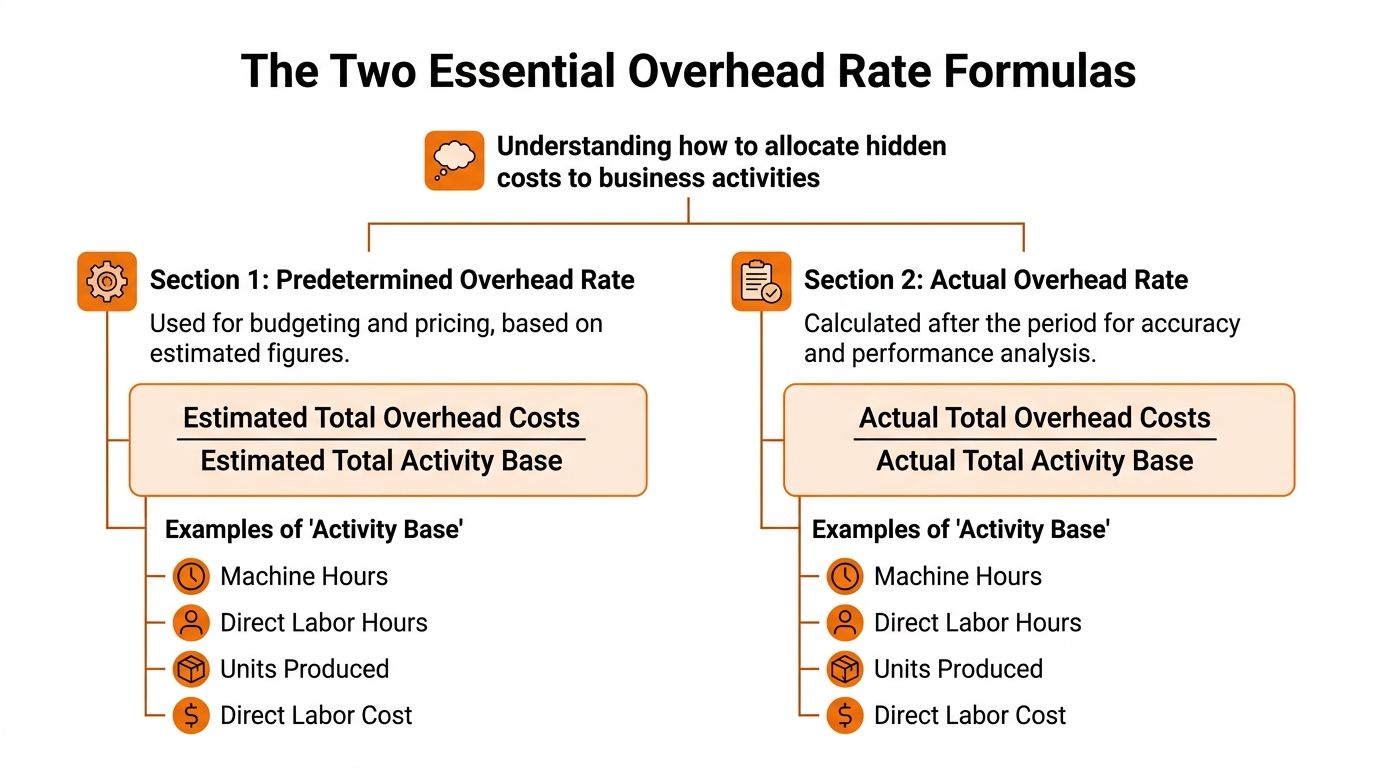
The Two Overhead Rate Formulas You Actually Need
Most businesses don’t need a dozen costing models. They need one solid method they’ll use every month, and maybe a second one when they need a different view.
The basic idea is simple. Take your total overhead costs and divide them by a sensible activity base.
Use labor hours when labor drives the work
If your business runs on people more than machines, the labor-hours method is usually the cleanest place to start.
The formula is straightforward:
Overhead rate per labor hour = Total overhead costs ÷ Total labor hours
This method has been a cornerstone of cost accounting since the early 20th century, and it’s still one of the most useful ways to allocate indirect cost in labor-heavy operations like retail, hospitality, and logistics, according to QuickBooks.
The example they give is simple enough to remember. If monthly overhead is $20,000 and your employees work 800 hours, the overhead rate is $25 per labor hour.
That means every labor hour carries $25 of indirect cost before you even think about direct wages.
Why this formula works
This method works because labor hours often reflect the actual load on the business.
More hours usually mean more supervision, more admin, more utilities, more support work, and more wear on the systems around the job. It isn’t perfect, but it’s practical.
It’s also common to look at overhead against direct labor cost instead of hours. The same QuickBooks source notes that labor-based rates are often 20-50% of direct labor costs, though they can reach 200% in SMBs, which means $2 of overhead for every $1 of direct labor cost.
Practical rule: If managers think in schedules and staffing, use labor hours. If finance thinks in payroll dollars, compare overhead to direct labor cost too.
Use revenue when you need a high-level operating view
The second formula is less precise for job costing, but very useful for management.
Overhead rate = Overhead costs ÷ Revenue
This gives you a broad efficiency measure. According to Wall Street Prep, if overhead is $40,000 and monthly sales are $200,000, your overhead rate is 20%. In another example, $50,000 of overhead on $200,000 of revenue gives you 25%.
This view answers a different question. Not “what does one hour cost us?” but “how much of every sales dollar goes to keeping the lights on?”
Which one should you pick
Use the formula that matches the decision you’re making.
Decision | Better formula | Why |
|---|---|---|
Pricing labor-heavy work | Labor hours | Ties overhead to actual team effort |
Comparing month-to-month efficiency | Revenue-based rate | Shows overhead as a share of sales |
Quoting service jobs | Labor hours | Easier to apply to estimates |
Reviewing overall business health | Revenue-based rate | Good for a quick management snapshot |
There’s also a distinction between predetermined and actual overhead rates.
A predetermined rate uses estimates for budgeting and quoting. An actual rate uses real numbers after the period ends. Both matter. One helps you price. The other tells you how close you were.
That’s the whole game, really. Pick the base that reflects how the business works. Then use it consistently.
Hunting Down Your True Overhead Costs
The formula is the easy part. The scavenger hunt is where people get stuck.
Most overhead data lives in too many places. A bit in QuickBooks or Xero. A bit in payroll. A bit in someone’s inbox. A bit on a company card no one reviewed properly. By the time you pull it together, you’ve already lost half a day and some confidence.
Start with buckets, not line items
Don’t begin by staring at a general ledger and hoping the pattern appears. Group costs into a few sensible buckets first.
Occupancy costs include rent, utilities, cleaning, repairs, and the ordinary bills tied to the space you operate from.
Administrative costs usually mean office salaries, payroll processing, HR tools, scheduling tools, phones, laptops, and software subscriptions.
General business costs catch the items people miss, like insurance, legal fees, accounting support, banking fees, and marketing spend that supports the whole business rather than one job.
Those buckets aren’t sacred. They’re just useful.
What matters is that you stop treating overhead like one blurry pile.
Find the data where it actually lives
This part is less elegant.
Rent may be in your accounting system. Benefits may sit with payroll. Software renewals may be spread across card statements. Shift coverage costs might only show up when you compare schedule changes against payroll exports.
If you need a practical refresher on what counts as a valid business cost in the first place, claiming business expenses is a helpful read because it forces you to think about documentation and categories the way finance people do.
For labor-heavy operations, direct labor is usually the anchor number that makes overhead allocation usable. If that piece is still fuzzy, this guide on https://pebb.io/insights/calculate-direct-labor-cost is worth keeping open in another tab while you build the model.
A simple working checklist
When I’m cleaning up overhead, I want one short list I can trust:
Pull recurring monthly costs first. Rent, software, insurance, payroll admin, and utilities are usually the backbone.
Add the irregular but real costs. Annual renewals and occasional support bills still belong in overhead. Spread them sensibly across the period you’re measuring.
Strip out direct costs. If a cost belongs only to one client, one job, or one product, keep it out of overhead.
Match the period. If you’re calculating a monthly overhead rate, every cost and every activity base should come from the same month.
The fastest way to ruin an overhead rate is mixing time periods. Monthly overhead with quarterly labor hours will give you a number that looks precise and tells you nothing.
What works and what doesn’t
What works is boring. One file. Clear categories. Consistent monthly review.
What doesn’t work is heroic spreadsheet archaeology done once a year. That gives you a postmortem, not a management tool.
If you want overhead to help pricing and staffing, the data has to be current enough to matter.
Overhead Rates in the Real World
Abstract formulas are fine. Real businesses make them useful.
Below are four common situations where the overhead rate helps you move from “we think this is working” to “we know what this costs.”
Retail store
A retail store usually has steady occupancy costs, admin support, and store-level operating costs that don’t attach neatly to one sale.
In that setting, labor hours are often a reasonable allocation base because staffing is one of the clearest drivers of day-to-day operating load. More trading hours, more staff coverage, more indirect cost.
A store manager can take total monthly overhead, divide it by total labor hours for the month, and get a cost per labor hour. Once that number is on the table, two questions become easier.
First, are certain shifts too expensive relative to what they produce? Second, are some locations carrying more overhead than their staffing pattern can justify?
The point isn’t to squeeze every hour. The point is to stop pretending every hour costs only wages.
Restaurant
Restaurants live and die by small decisions made fast.
A menu item can look profitable if you only count ingredients and kitchen wages. Then you remember the scheduling admin, cleaning contracts, management time, utilities, ordering systems, and everything else needed to get that plate out the door.
For restaurants, labor hours are often the most practical base because the operation rises and falls with staffing. If dinner service takes more people, more coordination, and more support, overhead follows.
A simple hourly overhead rate helps owners and operators answer plain questions:
Which service period is worth expanding
Whether menu pricing still covers the full operating load
How much slow prep time is costing
Restaurants don’t need ornate models first. They need one overhead number that’s honest enough to improve pricing and staffing choices.
Healthcare clinic
Clinics often have a different problem. Their costs are packed with support functions that feel fixed until volume changes and exposes the strain.
Reception, billing, compliance admin, scheduling, space costs, and general office systems all sit behind each appointment. A clinic may choose labor hours if staff time drives operations, or use a revenue-based rate when leadership wants a high-level operating view across services.
The overhead rate matters here because fee setting can drift out of sync with reality. A service can stay busy and still underperform once indirect support costs are assigned properly.
In healthcare settings especially, this number helps leaders separate activity from contribution. Those are not the same thing.
Busy clinics can still have weak pricing. Volume hides mistakes for a while.
Warehouse
Warehouses are a good reminder that the best allocation base depends on what drives cost.
Some warehouses still use labor hours. That’s sensible when picking, packing, receiving, and supervision are the main pressure points. Other operations may need a different base if space usage or equipment time better reflects the burden.
The practical test is simple. If your chosen base moves but overhead barely changes, it’s probably the wrong base.
A warehouse manager who knows the overhead rate can price storage, handling, or value-added services with more confidence. They can also spot when complexity is rising faster than the quoting model admits.
A side-by-side view
Industry | Total Monthly Overhead | Allocation Base | Calculated Rate | Business Implication |
|---|---|---|---|---|
Retail store | Monthly indirect operating costs | Total staff labor hours | Overhead cost per labor hour | Helps compare stores, shifts, and staffing patterns |
Restaurant | Monthly indirect operating costs | Kitchen and front-of-house labor hours | Overhead cost per labor hour | Helps adjust menu pricing and service-period staffing |
Healthcare clinic | Monthly indirect operating costs | Staff labor hours or revenue | Hourly rate or overhead as a share of revenue | Helps test whether fees cover support and admin load |
Warehouse | Monthly indirect operating costs | Labor hours or another cost driver that reflects operations | Rate per chosen activity base | Helps quote handling and storage more accurately |
What these examples have in common
Every one of these businesses has the same underlying problem. The direct costs are visible. The indirect costs are real but scattered.
The overhead rate gives those hidden costs a home.
Once you’ve got that number, better conversations follow. Managers stop arguing from instinct. Finance stops carrying the whole burden alone. Pricing gets less theatrical and more grounded in how the operation runs.
Common Mistakes and How to Improve Accuracy
Most overhead errors don’t look dramatic. They look tidy.
The spreadsheet balances. The formula works. The problem is that the inputs are wrong, incomplete, or too blunt to reflect reality.
The mistakes that keep showing up
Some problems are so common they might as well be standard.
Forgetting quiet costs. Software renewals, benefits, admin support, and similar items often get dropped because they aren’t attached to one job.
Using the wrong driver. If labor hours don’t really explain the cost pattern, the rate will mislead you.
Setting it once and walking away. Costs change. Staffing changes. The model has to keep up.
A lot of managers assume one plant-wide or company-wide rate is “good enough.” Sometimes it is. Sometimes it hides the complete picture.
When a single rate stops being enough
If your operation is simple, a single overhead rate can do the job well. But if different products, services, or workflows consume overhead in different ways, blunt allocation starts causing trouble.
That’s where Activity-Based Costing, or ABC, earns its keep. According to Matthew Marks, ABC can improve accuracy by 20-40% in high-overhead industries by using multiple activity pools instead of one plant-wide rate. Their example is clear: a $50,000 machine setup cost pool divided by 500 setups gives a $100 per setup rate.
That’s much closer to reality when setup work, inspections, or other non-volume tasks create cost.
But there’s a catch. The same source notes that 60% of ABC implementations fail due to poor cost driver selection.
That sounds harsh, but it matches what happens in practice. People build a more advanced model, then feed it weak assumptions.
Better costing doesn’t come from adding complexity. It comes from choosing drivers that actually reflect the work.
The remote and hybrid wrinkle
Modern overhead has gotten messier.
Some costs moved out of the office and into cloud tools, distributed support, home-work arrangements, and new management overhead. If your business still allocates cost as if everyone works in one place under one roof, your numbers can drift.
The same Matthew Marks source cites a 2026 Intuit report finding that 65% of mid-sized firms in retail and hospitality undervalue remote overhead, which skews profitability. That’s a useful warning, even if your team is only partly distributed.
In plain terms, remote and hybrid work didn’t remove overhead. It changed where it shows up.
A better way to tighten the model
If you want a more accurate overhead rate, don’t jump straight to a fancy framework. Fix the basics first.
Review categories regularly. New tools and support costs creep in.
Test the allocation base. Ask whether the chosen driver tracks the burden on the business.
Reconcile against operations. If the rate says one thing but managers see another, investigate both.
Improve labor records. Weak timesheet data weakens the whole model. If your process is still manual, this guide on https://pebb.io/insights/how-to-make-a-timesheet-in-excel helps show where those records usually start breaking down.
ABC can help. So can a simpler monthly labor-hours rate. The right answer isn’t always the most advanced one.
The right answer is the one your business can maintain without lying to itself.
How Pebb Helps You Find the Right Numbers
The hardest part of overhead isn’t division. It’s trust.
You need labor hours you believe. You need schedule data that matches payroll reality. You need something better than five versions of a spreadsheet emailed around by tired managers.
That’s where a unified work app earns its place.

One source of truth beats spreadsheet cleanup
When scheduling, clock-ins, PTO, team communication, and operational activity live in one place, the overhead calculation gets much less fragile.
Instead of chasing supervisors for missing hours, you start with cleaner operational data. Instead of guessing whether labor input is complete, you’ve got one record everyone can see. That doesn’t replace accounting. It makes the inputs to your costing model more believable.
If labor hours are your allocation base, this matters a lot.
The difference between a solid overhead rate and a misleading one is often just whether the hours were captured cleanly in the first place. A practical guide like https://pebb.io/insights/how-to-track-employee-hours shows the issue well. Bad time data doesn’t stay in one report. It contaminates pricing, staffing, and margin analysis.
Why this changes the day-to-day work
A unified system won’t magically decide which costs belong in overhead. You still have to do the thinking.
What it does do is remove the chaos around the operating data. That alone is a big step. Managers spend less time assembling numbers and more time discussing what they mean. Finance gets fewer patched-together exports. Operations gets a number it can use.
That’s the useful kind of simplification. Not less rigor. Less mess.
Beyond the Number
An overhead rate looks small on paper. One formula. One output. Maybe one tab in a workbook.
In real life, it’s more than that.
It tells you whether your prices are honest. It tells you whether growth is helping or just making the machine more expensive. It tells you whether the business is carrying hidden weight that no one has named yet.
Those seeking this number often do so for cleaner costing. The typical outcome is a clearer view of the business itself.
That’s worth the effort.
If your data is scattered, start there. If your categories are sloppy, fix them. If your current rate is built on hope, rebuild it on something sturdier. You don’t need a perfect model on day one. You need one you can trust enough to use.
If you’re tired of piecing together labor hours, schedules, and team activity from different tools, Pebb gives you one place to run the work and capture the numbers behind it. That makes overhead calculations less of a scavenger hunt and a lot more reliable.
