

Author: Ron Daniel
10 Metrics for Tracking Communication Effectiveness
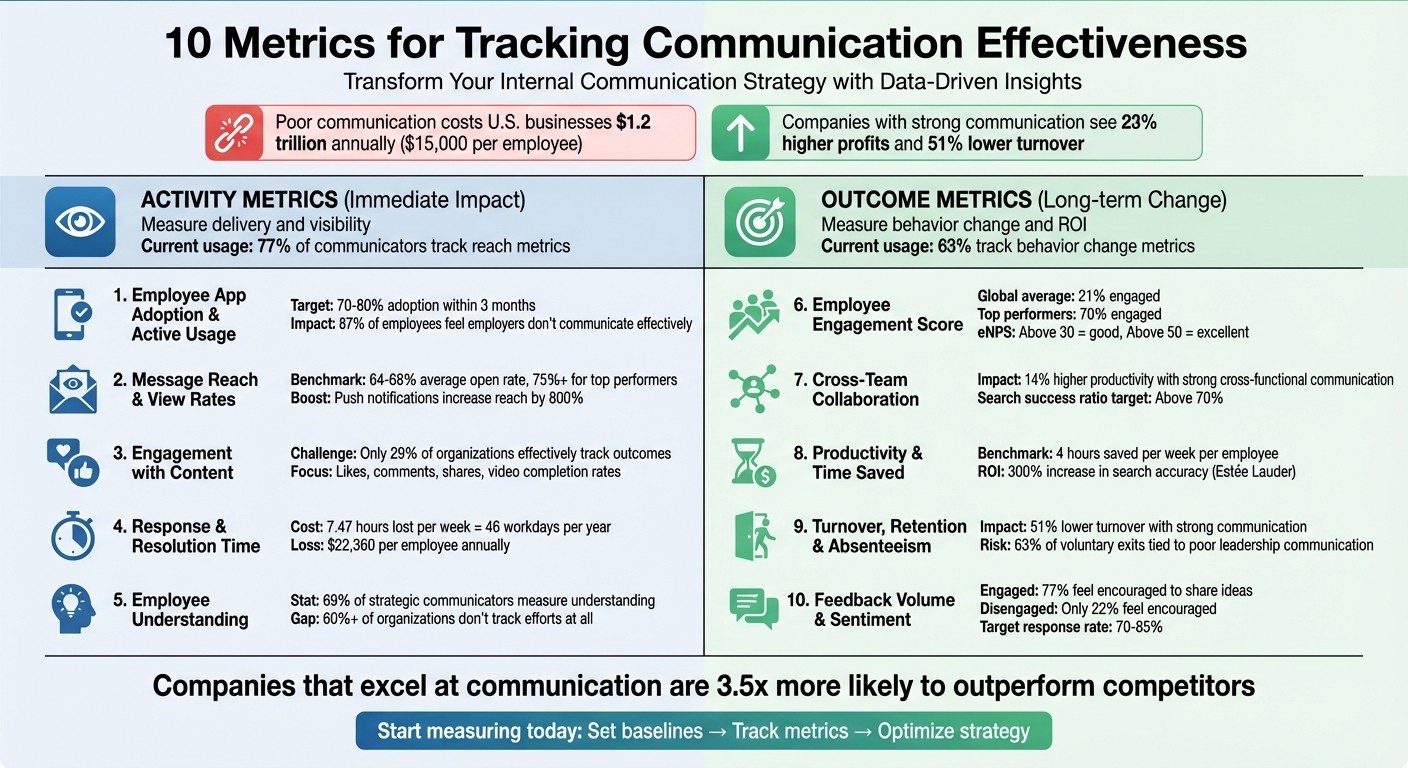
Ten metrics — adoption, reach, engagement, sentiment, retention and more — to measure internal communication impact and guide improvement.
"Did you know poor communication costs U.S. businesses a staggering $1.2 trillion every year? That’s about $15,000 per employee annually - or the equivalent of 46 workdays lost per person. Think about it: nearly two months of productivity gone, all because of miscommunication."
This isn't just a statistic; it's a wake-up call. Teams everywhere are wasting precious time trying to decode scattered messages, employees feel disconnected from their company’s mission, and leaders are left scratching their heads, wondering if their communication strategies are even landing. In fact, 41% of companies admit they struggle to measure communication effectiveness.
That’s exactly why we created Pebb. We saw the chaos: inboxes overflowing, employees disengaged, and no clear way to tie communication efforts to real results. But here’s the kicker - when organizations get internal communication right, they see 23% higher profits and 51% lower turnover. The impact is undeniable.
"Strong internal communication is the bridge between what leaders want to achieve and how employees experience the company every day." – Tim Vaughan, Poppulo
So, how do you know if your communication is actually working? At Pebb, we’ve zeroed in on 10 key metrics that turn vague assumptions into actionable insights. Whether you’re managing a retail team, a restaurant crew, or a fully remote workforce, these metrics will help you pinpoint what’s clicking and what needs a serious overhaul. Let’s dive in!
10 Key Metrics for Measuring Internal Communication Effectiveness
How to Use These Metrics
Before we dive into the 10 key metrics, let me break it down for you: there are two main types of metrics you’ll work with - activity metrics and outcome metrics. Understanding the difference is crucial.
Activity metrics are all about the immediate impact. They measure things like open rates, click-through rates, and page views - essentially, whether your message is being delivered and seen. These are the metrics most platforms track automatically, giving you instant feedback on how your content is performing.
Outcome metrics, on the other hand, go deeper. They measure whether your communication is actually driving change. Are employees shifting their behavior? Is retention improving? Are productivity levels climbing? These insights are harder to capture and often require a mix of surveys, business data, and, honestly, a bit of investigative work. Interestingly, 70% of internal communicators are now measuring impact specifically to prove ROI to leadership - a jump of 18% compared to previous years.
Here’s how we approach it at Pebb: we connect the dots between clicks and actual business outcomes. Gallagher's 2024 State of the Sector report sums it up perfectly:
"Strategic communicators focus more on 'outcome metrics' like behavior change rather than outputs, which are 'reach' metrics".
And the results? Reach metrics now hit 77%, while behavior change metrics are at 63%.
The key to success is blending both types of metrics. Use activity metrics to identify immediate issues - like a message that’s not getting opened. Then, layer in outcome metrics to figure out if your communication is actually making a difference. Segment your data, set clear baselines before launching new campaigns, and look for gaps. Tools like Pebb’s real-time dashboards simplify this process by consolidating all your data in one place.
Now that we’ve laid the groundwork, let’s dig into the metrics that can take your internal communication strategy to the next level.
1. Employee App Adoption and Active Usage
As the Superhuman Team puts it, "buying software is easy. Getting people to use it is hard". And honestly, they’re right. You can roll out the flashiest tool on the market, but if no one’s using it, what’s the point? That’s why I always recommend starting with two key metrics: adoption and active usage. These numbers don’t lie - they reveal whether your communication platform is solving real problems or just gathering dust.
Let’s start with adoption rate. It’s a simple calculation: take the number of unique users, divide it by the total number of employees with access, and multiply by 100. Ideally, you want to see a 70% to 80% adoption rate within the first three months of launching a tool. Anything lower? That’s a red flag. It could mean the app isn’t user-friendly, the training didn’t stick, or - worst of all - employees don’t find it valuable.
But here’s the thing: adoption is just the first step. What really gets interesting is login frequency. This metric is like the pulse of your platform, showing how often employees are actually logging in. Are they checking in daily, weekly, or just once before abandoning it entirely? At Pebb, we keep a close eye on daily and weekly active users. Why? Because it tells us if our platform has become a natural part of the workflow or if it’s just another app clogging up their home screens. High login frequency usually means the tool is sticky - it’s essential, not optional.
Then there’s feature-specific usage. This is where you can dig deeper. Which features are employees drawn to? Are they loving the news feed but skipping group chats? This kind of data is gold - it shows what’s working and what might need a tweak. Some mobile-first platforms have even hit an 80% adoption rate within just two weeks by focusing on the features employees actually need. That’s the kind of insight that can transform a tool from “meh” to “must-have.”
Here’s a stat that always sticks with me: 87% of corporate employees feel their employer doesn’t communicate effectively with them. Yet, highly engaged teams see 14% higher productivity and 23% more profits. That gap between poor communication and high engagement? That’s where adoption and usage metrics come into play. They help you zero in on what’s working and, just as importantly, what’s not.
2. Message Reach and View Rates
Your team is using the platform - awesome! But here’s the million-dollar question: are they actually seeing your messages? That’s where reach and view rates step in. These two metrics are like your communication pulse check, showing what percentage of employees actually opened or viewed your announcements. Because let’s face it, if no one reads your updates, all that effort goes straight down the drain.
Here’s the breakdown. Reach measures the percentage of employees who saw your message, not just the ones who received it. To calculate it, divide the number of unique opens by the total number of employees, then multiply by 100. For internal emails, the average open rate usually lands between 64% and 68%, but top-tier organizations can hit 75% or higher. If your numbers are falling short of these benchmarks, it’s probably time to rethink your approach.
Now, reach isn’t one-size-fits-all - it varies wildly by industry. Take healthcare, for instance, where the average open rate is 48.40%. On the other hand, push notifications can supercharge your reach, boosting it by over 800% compared to traditional methods. Reaching employees directly on their phones significantly increases the chances they’ll actually see your content.
One key tip: focus on unique opens, not total opens. Why? Because total opens can be misleading. For example, an email might get forwarded or scanned by security systems, inflating your numbers. At Pebb, we make sure unique views reflect actual engagement, not phantom clicks. For critical updates - like compliance or safety alerts - we take it a step further by using acknowledgment buttons. This way, employees can confirm they’ve read and understood the message.
Where things get really interesting is when you start segmenting your reach data. Break it down by department, location, or even device type. Let’s say you notice that one team’s open rate is lagging behind others. That’s a clear sign they’re not being reached effectively, and it might be time to roll out a mobile-first strategy. If some employees miss the message entirely, our platform makes it easy to resend push notifications specifically to them. By digging into these details, you can pinpoint gaps and fix them fast with targeted follow-ups.
3. Engagement with Content
Let’s talk about what happens after your employees open your messages. Are they just glancing at them, or are they actively engaging? This is where likes, comments, shares, and reactions come into play - they’re like the digital version of chatting by the water cooler, except now we can measure them down to the last click. These interactions tell you whether your message struck a chord or simply faded into the background.
At Pebb, we keep a close eye on these signals in real time. When employees like, comment on, or share a post, it’s a clear sign the content resonates. For example, tracking which announcements spark conversations - and which ones don’t - gives us a direct line to what’s working and what needs tweaking.
But don’t stop at surface-level metrics. Dive into deeper content consumption patterns. Are employees watching training videos all the way through, or are they dropping off halfway? If it’s the latter, it might be time to trim the video or make it more engaging. Similarly, document download stats can reveal which resources are hitting the mark. And don’t underestimate the value of qualitative feedback - comments or questions during events can provide a goldmine of insight into how employees feel and what they understand.
Here’s another trick: segment your engagement data. Break it down by department, location, or even device type. For instance, if the marketing team is thriving on long-form updates but another team isn’t, consider switching up the format - maybe shorter, mobile-friendly updates will do the trick. And if you see high share rates, take it as a sign that employees find the information useful enough to pass along.
One thing to avoid? Getting caught up in vanity metrics. Sure, seeing a post rack up 200 likes feels great, but the real question is: does it lead to action? Are employees clicking through to read the full announcement? Are they downloading that new safety guideline? Are the comments thoughtful and relevant? That’s the kind of engagement that drives real impact. Here’s a startling stat: only 29% of organizations effectively track the outcomes of their communication efforts. That means most teams are operating in the dark. Don’t let that be you - track engagement in a way that truly matters.
4. Response and Resolution Time
Let’s talk about speed. Delayed responses? They’re momentum killers. At Pebb, we keep a close eye on two key metrics: response time (how quickly someone acknowledges a message) and resolution time (how fast an issue actually gets solved). Why? Because inefficiencies in communication can cost more than just time.
Here’s a staggering stat: teams lose about 7.47 hours a week due to communication hiccups. That’s nearly an entire workday gone. And it gets worse - employees spend an average of 46 workdays a year just clarifying information. This translates to a jaw-dropping $22,360 per employee in lost productivity. As the team at Superhuman so aptly puts it:
"Slow responses kill momentum. When people wait days for simple answers, projects stall and opportunities slip away."
Setting the Right Expectations
The solution starts with clarity. Different messages demand different response times. For example:
Urgent alerts? They might need acknowledgment within hours.
Routine questions? A day or two might be fine.
At Pebb, we’ve streamlined this process by centralizing tasks, news feeds, and chats. Nothing gets buried or forgotten. And when teams using tools like Superhuman started tracking their response times, they shaved off 12 hours from their average response time and managed twice as many messages in the same span.
Quick Replies Aren’t Enough
Here’s the thing: a fast “Got it!” doesn’t mean the issue is resolved. That’s why we also measure resolution time. It’s not just about replying quickly - it’s about solving problems efficiently. And the impact is real. Organizations that use people analytics to measure communication see a 25% boost in productivity. Even better? AI-driven tools can cut technical communication tasks by 56%.
Where to Start
Before diving into new tools or processes, establish a baseline. Measure your current response and resolution times. Then, as you implement changes, track the progress. For us, regularly auditing communication channels has been a game-changer. If the team prefers Pebb over email for urgent messages, we adapt and shift accordingly. Meeting people where they already are is half the battle - and it’s one that pays off in faster response times and smoother workflows.
5. Employee Understanding of Key Messages
Here’s a staggering fact: 41% of businesses have no way to track how much of their content is actually being viewed on internal channels. And let’s be honest - just because someone opens a message doesn’t mean they’ve understood it. At Pebb, we’ve learned this the hard way. Sending out a message is one thing; making sure it sticks is a whole different ballgame. True effectiveness comes down to comprehension, not just delivery.
Testing What Actually Sticks
One of the best ways to figure out if your message has landed? Test it. Knowledge quizzes are a simple yet powerful tool to measure whether employees have absorbed key information, like a new policy or safety protocol. You can even calculate a clear comprehension rate using this formula:
(Number of correct responses / Total number of questions) x 100.
For high-stakes content, like compliance or safety documents, many organizations take it a step further by adding acknowledgment buttons. These require employees to confirm they’ve read and understood the material. It’s a straightforward way to ensure accountability.
But here’s where it gets interesting - pulse surveys. These quick, open-ended surveys let employees share their understanding in their own words. They’re like a real-time feedback loop, often uncovering gaps you might not even know existed. Gary Moss, Director of Internal Communication at Gallagher, summed it up perfectly:
"Years of conducting audits have shown us how invaluable they can be - one client even described their audit as 'gold dust' in resetting their internal comms approach".
This approach gives you a baseline to dig deeper into how your messages are being interpreted and acted upon.
The Reality Check
Once you’ve got those quiz results and survey insights, it’s time to ask the big question: Are employees actually putting what they’ve learned into practice? This is where behavioral analysis comes in. Did they adopt the new procedures? Are communication-related mistakes decreasing? These are the real indicators of whether your message hit home.
Here’s a telling stat: 69% of strategic internal communicators measure understanding. Yet, more than 60% of organizations don’t track their efforts at all. That’s a huge missed opportunity. At Pebb, analytics are available in our Premium plan to go beyond surface-level metrics like message opens. We track how teams are engaging with content because understanding isn’t static - it shifts depending on roles, departments, and even locations. Many larger organizations are now using cohort analysis to pinpoint exactly where their messaging is falling flat.
At the end of the day, actions speak louder than words. It’s not just about what employees say they understand - it’s about what they do. Are they following through? When you focus on ensuring messages are not just seen but truly understood, you create internal communications that drive real, measurable results. And that’s the ultimate win.
6. Employee Engagement Score
Let me tell you, this is the kind of thing that keeps me tossing and turning at night: global employee engagement has plummeted to just 21%, while some top-tier organizations are hitting rates as high as 70%. That’s a jaw-dropping difference, and more often than not, it boils down to one thing - communication. At Pebb, we’ve seen it up close. How you communicate can either pull your team together or leave them feeling like they’re drifting apart.
Turning Gut Feelings Into Hard Numbers
Here’s where engagement scores come in. They take those fuzzy feelings about workplace culture and turn them into solid, actionable data. One of the best tools for this is the Employee Net Promoter Score (eNPS). The question is simple: “On a scale of 0–10, how likely are you to recommend this company as a place to work?”. Then, you crunch the numbers: subtract the percentage of detractors (those scoring 0–6) from the percentage of promoters (those scoring 9–10). If your score is above 30, you’re doing well. Above 50? You’re in great shape.
But here’s the thing - those numbers only tell part of the story. To really understand what’s driving engagement, you’ve got to dig deeper. Add questions like, “Does leadership communicate goals clearly?” or “Do you feel encouraged to share ideas?” The difference can be staggering: 77% of engaged employees say they feel encouraged to share ideas, compared to just 22% of disengaged employees. This kind of insight has completely changed how we approach surveys at Pebb.
Why We Ditched Annual Surveys
Here’s a lesson we’ve learned the hard way: annual surveys just don’t cut it anymore. Think about it - waiting an entire year to find out your team feels disconnected is like checking your bank balance once a year and being shocked you’re broke. That’s why we’ve switched to pulse checks. These are short, frequent surveys that give us a real-time read on how our team is feeling. They’re quick, actionable, and, most importantly, they let us course-correct before small issues snowball into big problems.
When you tie engagement scores to how effectively you’re communicating, you’re not just measuring feelings - you’re measuring tangible outcomes like retention, productivity, and even revenue. Companies with high engagement levels see 10% better customer ratings and an 18% boost in sales. That’s the kind of impact that makes all the effort worth it.
7. Collaboration and Cross-Team Interaction
Let me paint a picture: marketing doesn’t hear about the latest product updates, sales is blindsided by a new launch, and operations redoes processes that finance already streamlined. Sound familiar? These silos don’t just slow things down - they waste time and money. And trust me, I’ve seen how quickly they can derail progress.
Here’s the deal: tracking how often teams collaborate across departments is essential. The formula is simple - take the number of cross-team communications, add shared projects and interdepartmental meetings, then divide by your total team communications. If that number looks low, it’s a red flag. Companies that excel at cross-functional communication enjoy 14% higher productivity. That’s not just a small boost; it’s a massive shift in how work gets done.
But frequency isn’t the whole story. You’ve got to measure how easily people can find the information they need. This is where the successful search ratio comes in - divide the number of successful searches by total search attempts. If this number dips below 70%, you’ve got a bottleneck. Estée Lauder tackled this issue head-on and saw a 300% increase in search accuracy. Imagine the difference between employees spending hours chasing answers versus actually doing their jobs. These metrics can pinpoint exactly where collaboration is thriving - and where it’s falling apart.
At Pebb, we’ve built tools to tear down these silos. Our group chats and spaces make it easy for teams to collaborate on specific projects while keeping the whole company in the loop. For instance, when marketing shares a big win, production knows about it instantly. When operations updates a process, finance is in the know. It’s all about visibility - without overwhelming people with irrelevant noise. Plus, our employee directory makes finding the right person in another department a matter of seconds, not a week of email tag. These tools aren’t just about convenience - they directly impact how effectively teams communicate and work together.
If you’re not keeping tabs on cross-department interactions, you’re essentially flying blind. Start measuring how often teams collaborate and how easily they access information. Patterns will emerge, showing you where collaboration is flourishing and where it’s breaking down.
"Segmentation can also be used to help identify common threads or trends amongst unique groups of individuals. That gives you the opportunity for comparison, identifying highly engaged groups versus the groups that are the least engaged".
These insights are the key to transforming disconnected teams into a unified, high-performing powerhouse. Silos don’t stand a chance when you’ve got the right tools and data to connect the dots.
8. Productivity and Time Saved
Let me hit you with a jaw-dropping stat: poor communication eats up nearly an entire workday every single week. Now, imagine that ripple effect across your entire organization - it adds up to a staggering $1.2 trillion in annual losses. That’s money slipping through the cracks just because communication isn’t streamlined. If you’re not keeping tabs on how much time your communication tools save - or waste - you’re essentially leaving cash on the table. Let’s dig into how better communication directly translates into measurable productivity gains.
Here’s the formula we use: calculate the average number of minutes saved per employee each week thanks to improved communication processes. Start by establishing a baseline - how much time does it currently take to access key info or complete routine tasks? After implementing improvements, track the time saved. Multiply those saved minutes by your team’s average hourly cost, and suddenly, you’ve got hard numbers that even the most skeptical CFO can’t ignore.
The results speak for themselves. Real-world examples show companies saving time equivalent to 13 full-time positions (Boston Consulting Group, 2024), boosting search accuracy by 300% (Estée Lauder, 2024), and helping users save 4 hours per week by speeding up responses (Superhuman Mail, 2025).
At Pebb, we’ve experienced this transformation firsthand. By consolidating communication and operations into a single platform, we’ve eliminated the endless app-switching that drains productivity. Imagine this: your team can find information in seconds using our Knowledge Library, chat with colleagues without juggling email, and even manage schedules or submit time-off requests - all in one spot. That’s not just convenience; that’s hours saved every week. And here’s the kicker - Pebb’s all-in-one employee app is priced at just $4 per user per month (or free for up to 15 employees). No more toggling between apps. Just streamlined workflows and maximum productivity.
"Workers who are satisfied with communication are approximately twice as productive as dissatisfied workers." – Deloitte
Here’s what I recommend: track how much time your team spends on communication tasks this week. Audit your channels to pinpoint which platforms are helping and which ones are just noise. Then, measure the “time-to-find” for critical information. If it takes longer than a couple of minutes to locate what someone needs, you’ve got a productivity bottleneck that needs fixing. The data will guide you to the exact areas that need attention. When you start tracking these gains, you turn abstract improvements into concrete metrics - proof of just how impactful efficient communication can be.
9. Turnover, Retention, and Absenteeism
Did you know that companies with strong internal communication see 51% lower turnover rates than those with poor communication? That statistic alone should make any leader sit up and pay attention. Here's another eye-opener: 63% of voluntary employee exits are tied directly to poor leadership communication. When communication breaks down, employees feel disconnected, and that disconnection leads to higher turnover and dwindling engagement. It’s a vicious cycle, but it’s one we can break.
Here’s the kicker: engaged employees are 3.4 times less likely to be actively job hunting compared to their disengaged counterparts. Yet, even though 56% of communicators are tasked with improving retention, only 40% actually track it as a measurable metric. That gap between responsibility and action is where things fall apart. The solution? Start correlating your employee engagement scores with turnover rates in different departments. This approach reveals exactly where communication is failing and why people are leaving.
But turnover isn’t the only metric to watch. Absenteeism is another red flag that can signal disengagement before it spirals. Frequent absences - especially short-term ones - often point to deeper issues than just physical health. Patterns like calling in sick every Monday? That’s usually a sign of a disconnect from the workplace. Tools like the Bradford Factor ($S^2 \times D = B$, where S is the number of absences and D is total days absent) can help you identify these patterns early on. Spotting these trends gives you the chance to intervene before a disengaged employee becomes a former employee.
At Pebb, we’ve seen firsthand how better communication and operations drive retention. Our platform brings everything employees need into one place - company updates in the News Feed, time-off requests, answers in the Knowledge Library, tasks, digital forms, calendar events, and real-time connections through Work Chat. When people feel supported and valued, they’re far more likely to stick around. And here’s the best part: for teams with up to 15 employees, Pebb’s Standard plan is completely free. For larger teams, our Premium plan is just $4/user/month. Compare that to the $15,000 per employee per year that poor communication costs companies, and the value becomes crystal clear.
"Internal communication plays a crucial role in keeping everyone in your company on the same page... if they don't feel a sense of connection or belonging, it leads to lower productivity and increased attrition." – Tim Vaughan, Poppulo
Here’s what you can do today: track turnover alongside metrics like message reach, engagement, and feedback. If turnover spikes in a specific department, dig into the data. Are employees missing key updates? Are leadership messages falling flat? Are questions going unanswered? The numbers will guide you to the root of the problem - and show you how to fix it before more people head for the door.
10. Feedback Volume and Sentiment
Here’s a stat that always gets me thinking: 77% of engaged employees feel encouraged to share their ideas, but only 22% of disengaged employees do. That’s a staggering gap, and it tells a powerful story. When people stop speaking up, it’s rarely because they’ve run out of ideas - it’s because they don’t think anyone’s listening. And that silence? It can come with a hefty price tag.
At Pebb, we’ve learned that tracking feedback isn’t just about tallying up survey responses. It’s about digging into two key factors: the volume of participation and the sentiment behind those responses. One metric we keep a close eye on is the Feedback Response Rate - the percentage of employee feedback that gets a response from leadership. When that rate sits between 70% and 85%, we know we’re fostering a healthy communication culture. But if it dips below 50%, it’s a red flag for disengagement. And here’s another tough truth: over 50% of employees feel their feedback doesn’t lead to meaningful change, while only 25% believe it results in action. That’s why we don’t just stop at the numbers - we dig deeper.
AI-powered sentiment tools have been a game-changer for us. These tools can sift through thousands of messages, classifying them as positive, negative, or neutral. But here’s the thing: we don’t rely on AI alone. Numbers can tell you what’s happening, but they don’t always explain why. That’s where qualitative insights come in. By combining survey scores and response rates with open-ended feedback and discussions, we uncover the real stories behind the trends. For instance, our News Feed and Clubs features naturally encourage employees to share their thoughts. Meanwhile, our analytics help leadership identify patterns early, so small issues don’t snowball into bigger problems.
Another critical metric we track is the Employee Feedback Implementation Rate - the percentage of suggestions that lead to actual changes. When employees see their ideas turn into action, it motivates them to keep contributing. But when feedback is ignored? Engagement takes a nosedive. To keep the momentum going, we rely on pulse surveys for regular check-ins instead of waiting for annual reviews. We also monitor comments and reactions on our internal platforms, which have become the modern-day equivalent of those water cooler chats. These small but consistent practices help us turn feedback into action.
"There's a fine line between gathering, analyzing, and applying feedback. If they cannot execute on system feedback directly, employees providing feedback immediately lose faith." – Maddy Rieman, Head of Customer Success, Cerkl
To make feedback truly effective, we close the loop by following a structured approach. First, we establish baseline measurements before rolling out any new communication strategies. Then, we ensure all feedback remains anonymous to encourage honesty. Finally, we segment the data by department or location to pinpoint where engagement might be lagging.
With Pebb’s free Standard plan (supporting up to 15 employees) or our Premium plan at just $4 per user per month, we provide the tools to track these patterns without breaking the bank. By combining feedback volume with sentiment analysis, we’re not just measuring communication - we’re creating a workplace where every voice truly matters.
Building a Communication Dashboard
When we first started thinking about how to make data work for internal communication, we realized something crucial: having scattered metrics is like trying to assemble a puzzle without the picture on the box. That’s why bringing all those individual data points into a single, unified dashboard is a game-changer. It’s not just about convenience - it’s about making decisions faster and with more confidence. Here’s a stat that stuck with me: 84% of internal communicators want better tools to measure their impact. That’s exactly why we offer analytics in Pebb’s Premium plan - because tracking your efforts shouldn’t feel like rocket science.
Our dashboard pulls together data from news feeds, mobile apps, and group chats, giving you a bird’s-eye view of everything from message reach and engagement rates to response times and sentiment trends. And the best part? It updates in real time. Imagine being able to tweak your strategy on the fly. When Boston Consulting Group rolled out advanced communication tools in December 2025, they saved the equivalent of 13 full-time positions just by streamlining their information flow. That’s the kind of efficiency we’re talking about.
What’s really powerful is how you can segment the data. By breaking it down by department, location, or even employee tenure, you can zero in on where things might be falling short. For instance, if you notice frontline teams aren’t reading company announcements while other groups are, it’s probably time to rethink your mobile strategy. Here’s a surprising twist: 70% of organizations use metrics to prove ROI to leadership, but 70% of executives don’t even ask for them. A well-designed dashboard doesn’t just deliver numbers - it tells a story that’s hard to ignore.
"If you can't track and measure the performance of your communications, you have no way of proving they're achieving business goals." – Tim Vaughan, Poppulo
And here’s where Pebb makes it easy. With our Premium plan at just $4 per user per month, you get full access to analytics that cover all ten metrics we’ve talked about - from adoption rates to feedback sentiment and productivity boosts. For smaller teams or those just starting out, our Standard plan is free for up to 15 employees and includes core features to get you going. You can even compare current results to past campaigns, turning raw data into actionable insights. With these tools, you’ll have everything you need to craft smarter communication strategies that actually move the needle.
Conclusion
Measuring the right metrics can completely transform how teams connect, collaborate, and get things done. By focusing on key indicators like message reach, engagement rates, and response times, we can pinpoint exactly where communication is thriving - and where it’s falling apart. Poor communication isn’t just frustrating; it’s expensive, draining both time and money. On the flip side, companies that nail communication are 3.5 times more likely to outperform their competition.
These numbers make one thing crystal clear: effective communication isn’t just a “nice-to-have” - it’s a direct driver of business success. Engaged employees stick around longer, which means lower turnover costs, better retention, and a more stable, productive team. And when you know which communication channels are actually working, you can stop wasting resources on what doesn’t and double down on what does.
"Measurement is not a one-time event but an ongoing process of learning, adapting, and optimizing to meet the evolving needs of your workforce." – Selerix
This mindset is exactly what fuels our work at Pebb. We’ve built our platform to turn raw data into actionable insights, helping teams communicate and operate better at every level. Our Premium plan, priced at just $4/user/month, gives you analytics across ten critical metrics. And if you’re just starting out, our Standard plan is completely free for up to 15 employees. It includes essential features to show you what’s working - no spreadsheets, no manual reporting, just everything you need in one place.
Here’s my advice: take a hard look at where your communication stands today. Set clear goals, and let the data guide your next move. Regular audits paired with a data-driven strategy will keep you on the path to continuous improvement. With the right metrics and tools, communication stops being a guessing game and becomes a strategic advantage that drives meaningful results.
FAQs
How does Pebb improve internal communication and help reduce employee turnover?
Pebb brings everything your team needs for seamless internal communication and operations into one all-in-one employee app. From group chats and news feeds to directories and voice/video calls, it’s designed to keep your employees connected, informed, and in sync - without the hassle of juggling multiple tools.
Here’s where it gets even better: Pebb’s Premium analytics give you a clear view of engagement and turnover trends. This means you can pinpoint what’s working and where there’s room to grow. When employees feel genuinely heard and valued, retention improves, and turnover naturally drops. It’s a straightforward formula that works!
What’s the difference between activity metrics and outcome metrics in internal communication?
Activity metrics are like the heartbeat of your communication tools - they give you a real-time view of what’s happening. For instance, you can track how many messages are being sent, the frequency of comments, or the number of clicks a news post gets. These numbers help you identify patterns, understand engagement levels, and ensure features like Pebb’s chat, news feed, or groups are being used the way they’re meant to be.
Now, outcome metrics are where you see the bigger picture - they show the results. These metrics focus on the impact your communication efforts have on the business. Think along the lines of higher employee engagement, lower turnover rates, or quicker decision-making. Essentially, while activity metrics tell you if people are using the tools, outcome metrics demonstrate their value to your organization. Together, they’re the secret sauce for refining your communication strategy and making sure Pebb delivers meaningful results for your team.
Why is it important to measure the effectiveness of internal communication?
Measuring how well your internal communication is working goes beyond just crunching numbers. It’s about figuring out if your messages are hitting home with your team and actually making an impact. Metrics like open rates, response times, and employee sentiment scores give you a clear picture of what’s clicking and what needs some fine-tuning. And here’s the kicker - this data ties directly to business goals like speeding up onboarding, ensuring compliance, and navigating change more smoothly.
At Pebb, we’ve made keeping track of these metrics a breeze. Tools like chat read receipts and engagement dashboards help you stay on top of communication trends. When you’re in sync with your team, it’s not just about better alignment and engagement - you're also setting the stage for higher productivity, lower turnover, and stronger business results. Plus, with Pebb’s free Standard plan for up to 15 employees or our Premium plan at just $4/user/month, turning communication into a real competitive edge has never been easier.
