
A Calmer Guide to Measuring Employee Engagement
Stop chasing scores. This guide offers a practical, human-centered approach to measuring employee engagement, turning ambiguous data into meaningful action.
Dan Robin

For a long time, the whole song-and-dance around measuring employee engagement felt… off. It usually kicked off with a huge annual survey and ended with some vague scores that nobody knew what to do with. We learned there’s a much better way. It starts with ditching that once-a-year ritual and adopting a continuous, calm process of listening—one that actually respects people’s time and gives you insights you can work with.
Why We Stopped Chasing Engagement Scores
Let's be honest. For years, measuring employee engagement felt like a corporate exercise nobody really believed in. We’d send out a massive annual survey, wait weeks for the results, and then stare at a bunch of percentages that didn't feel connected to the real world. Leadership would nod, promise to "look into it," and then... crickets.
The problem wasn't the intention. Everyone wants a workplace where people feel connected and motivated. The issue was the instrument itself. An annual survey is just a snapshot in time, and often a blurry one at that. By the time you get the data, the moment has passed. The feedback is stale, and the whole process feels completely disconnected from the daily rhythm of work.
The Disconnect Between Data and Reality
This gap is especially glaring for frontline teams. When your workforce isn't sitting at a desk all day, a long, clunky survey feels more like a burden than an opportunity to be heard. The low participation rates alone told us something was deeply wrong. We were asking people who work on their feet to find time for a 60-question survey that was clearly designed for an office. It just didn't fit their world.
The result? We were chasing a vanity metric—a single, company-wide “engagement score” that smoothed over all the important nuances. It hid the real stories. It couldn't tell us why the night shift in the warehouse felt more connected than the daytime retail staff, or what was really happening within a specific department.
We realized that trying to capture the complexity of human experience in a single number was a fool's errand. It's like trying to understand a forest by only measuring its average height.
A More Grounded Approach
This isn’t just a hunch; the broader data paints a stark picture. A revealing Gallup report found that a mere 23% of employees worldwide are truly engaged at work. This means the vast majority are either "quiet quitting" (doing the bare minimum) or "loud quitting." This isn't a problem to be solved with one big survey. Discover more about these global workplace trends.
So, we decided to abandon the big annual event. We moved toward a calmer, more continuous approach. This guide is about our journey from chasing scores to starting conversations. We’ll share how we shifted from a once-a-year spectacle to a subtle, ongoing process of listening—one that provides real insights and, more importantly, shows our team we’re actually paying attention.
It’s about building a better company, not just getting a better report card.
Choosing Metrics That Actually Tell a Story
Before you can measure anything, you have to know what you’re actually looking for. For years, the standard advice was to ask dozens of questions, hoping that a massive data dump would magically reveal the truth.
It never did. It just created noise.
I've learned that a small handful of core metrics, when looked at together, paint a remarkably clear picture. This isn't about chasing a single, perfect score. It’s about viewing the situation from a few different angles to understand the whole story.
Finding Your Core Indicators
The classic starting point is the employee Net Promoter Score (eNPS). It’s a simple but powerful question: “On a scale of 0-10, how likely are you to recommend this company as a great place to work?”
The magic of eNPS is its focus on advocacy. An employee might be satisfied with their pay, but would they stick their neck out to recommend the company to a friend? That distinction says a lot.
But eNPS is just one piece. We also need a simple engagement index—a few targeted questions that get to the heart of pride, motivation, and commitment. Are people genuinely proud to work here? Do they feel motivated to go beyond what’s required? These questions dig into their emotional investment.
This decision tree shows the fork in the road so many companies face: sticking with vague, old-school surveys or moving toward a more dynamic approach.
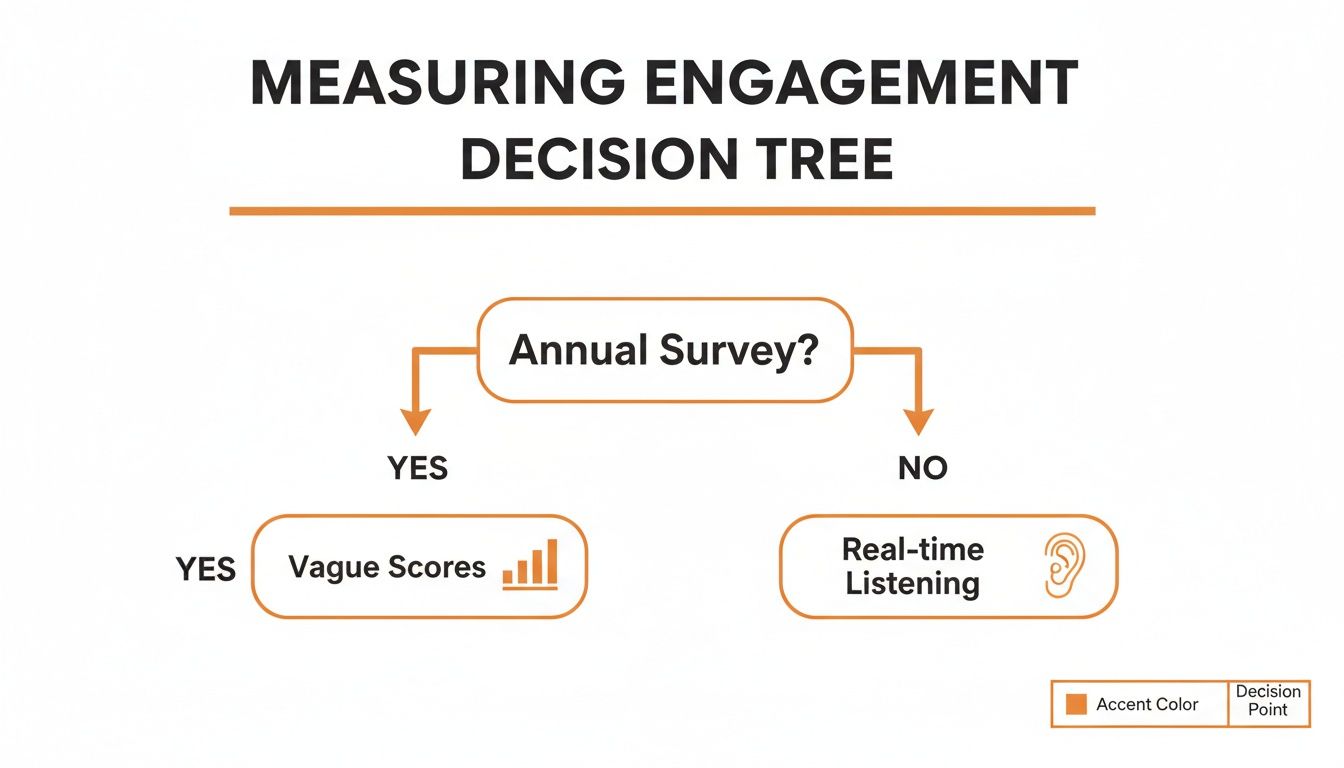
Honestly, the path you choose here determines the quality of the story your data will ever tell you.
Looking Beyond the Survey
Here’s a crucial insight: what people say is only half the story. What they do is often more revealing. This is where behavioral signals come in. And no, we’re not talking about spying on people. We’re talking about understanding the natural, everyday flow of work.
Think about participation rates. When the company posts a critical update, who reads it? If readership is consistently low in one department, that’s a flashing red light for disconnection. It’s a signal a generic survey question about "communication effectiveness" could never capture.
Similarly, activity within a team’s digital workspace can be a powerful proxy for connection. Are team members in a specific store actively sharing information in their app? High activity suggests a healthy, connected team. Low activity might mean they’re disengaged or, worse, using unsanctioned tools like WhatsApp to get things done.
The goal isn’t to collect data for data’s sake. It’s to find signals that reflect real human behavior and tell you where to focus your attention. A quiet team isn't necessarily a problem, but a suddenly silent one almost always is.
Key Engagement Metrics and What They Really Mean
The right mix of metrics depends entirely on your workforce. A company with software engineers has very different behavioral signals than one with distributed retail associates. This table breaks down a few key metrics and how you might apply them.
Metric | What It Measures | Example for Desk Teams | Example for Frontline Teams |
|---|---|---|---|
eNPS | Employee advocacy and loyalty | How likely are you to recommend our engineering org to a friend? | How likely are you to recommend working at this specific location to a friend? |
Engagement Index | Pride, motivation, and commitment | "I see myself still working here in two years' time." | "I am proud to tell others I work for this company." |
Participation | Active involvement and connection | Readership of all-hands meeting notes; sign-ups for learning sessions. | Views on critical safety updates; engagement with new shift schedules. |
Behavioral Signals | Collaboration and daily interaction | Activity in project management tools (e.g., Jira, Asana). | Activity within the team's communication app; shift-swapping rates. |
Retention Rate | Overall stability and satisfaction | Voluntary turnover rate within the product development department. | Voluntary turnover rate among associates with less than 1 year of tenure. |
Ultimately, aim for a small, curated set of 3-5 key metrics. Choose indicators that give you a lens into both sentiment (what they say) and behavior (what they do). We've actually written more about the 3 metrics that actually predict employee engagement if you want to dive deeper.
This combined approach gives you a balanced, truthful view of what’s really happening. It’s how you move from just measuring things to truly understanding your people.
How to Ask and Listen for Real Answers
How you ask is just as important as what you ask. For years, we were all stuck with the dreaded 60-question annual survey. It was a beast—tedious for employees and delivering data that was already stale by the time we got it.
I think we all knew there had to be a calmer, more rhythmic way to understand what was going on.
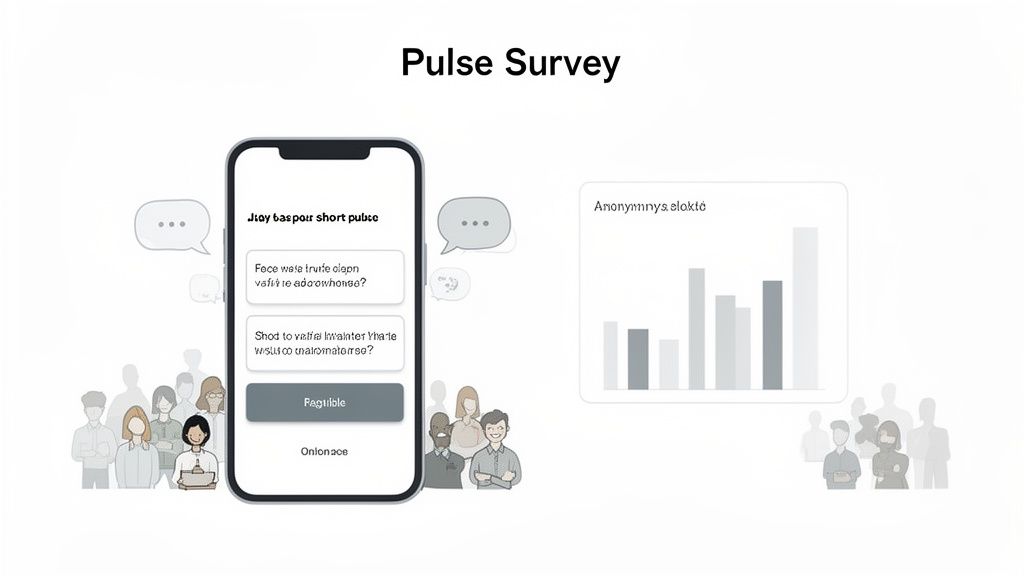
The Power of the Pulse
Instead of one giant, disruptive event, think of listening as a gentle, recurring pulse. We shifted to lightweight pulse surveys—just a few crucial questions sent out quarterly. This approach respects people's time and gives you a living trend line instead of a single, static snapshot from six months ago.
Delivery is everything, especially for frontline teams. You have to meet them where they are. This means sending surveys through a simple mobile app they use, not directing them to a clunky desktop portal they might see once a week. Making it easy is the first step toward getting honest answers.
The questions themselves shouldn't feel like they were cooked up in a lab. Keep them simple and human. Instead of asking someone to rate their "strategic alignment," try something grounded in their actual experience.
Here are a few that get to the heart of what matters:
For Clarity: "Do you have a clear understanding of what you need to do to be successful in your role?"
For Recognition: "In the last month, have you felt genuinely appreciated for your work?"
For Connection: "Do you feel you have a real connection with your immediate team?"
For Growth: "Do you believe you have good opportunities to learn and grow here?"
These questions don't require a manual to understand. They tap into the core of the employee experience and give you a clear signal on what's working and what isn't.
Listening Without Asking
But that’s only half the story. Some of the most honest feedback isn't given; it's observed. This is where you tap into passive, behavioral data—the subtle, aggregated signals from the tools your teams already use every day.
Let’s be crystal clear: this is not about surveillance. It’s about understanding the natural flow of work in an anonymized, respectful way. It’s about finding the unfiltered truth in the digital breadcrumbs of daily operations.
The most powerful insights often come from observing natural behavior. An empty town square tells you more about a community than a survey ever could. The same is true for a digital workspace.
Think about what these signals can tell you. When you post a critical company update, what’s the readership rate? If only 30% of your warehouse team reads a new safety protocol, you have a clarity problem, not just a communication one. That's a real data point that a vague survey question about "internal comms" would miss.
Or consider communication patterns. Are teams in your Boston store communicating as frequently as the teams in your Chicago store? A sudden drop-off in activity can be an early warning sign of friction, disconnection, or a manager who needs support.
The Unfiltered Signal from the Ground
When you combine these two methods—the active listening of pulse surveys and the passive observation of behavioral data—you get a rich, multi-dimensional view. You get both the stated sentiment and the revealed reality. You can dig deeper into how to make employees feel seen without another survey in our other guides.
This approach shifts engagement measurement from a periodic event to a continuous, subtle process of just paying attention. It’s about listening to the quiet signals just as much as the loud ones. It's how you get a true sense of what’s happening on the ground, day in and day out.
Making Sense of the Data Without a PhD
Alright, so you’ve gathered the feedback. You’re looking at numbers, charts, and percentages. The easy part is over. Now comes the real work—the human part—of turning all that raw data into something that makes sense. Something you can use.
For a long time, this was the step that felt like you needed a data scientist on speed dial. But I've learned the most powerful insights don't come from a fancy model; they come from asking simple, curious questions.
The most important question you can ask is this: "Compared to what?"
A single, company-wide engagement score is practically useless. It’s an average of averages, smoothing over all the real stories happening inside your teams. An 8/10 engagement score might look great on a slide, but what if it's hiding a 10/10 from your engineering team and a dismal 4/10 from your burnt-out customer support crew? The average is misleading.
The Simple Power of Slicing the Data
This is where the simple act of segmentation comes in. Don't let the word intimidate you. It’s nothing more than looking at your data through different lenses. Instead of staring at the whole picture, you zoom in on the parts that matter.
You don’t need a fancy dashboard to get started. You just need to ask a few clarifying questions:
By Department: How does the marketing team feel compared to the logistics crew?
By Location: Is the experience in our downtown store different from our suburban one?
By Role: Are our shift supervisors feeling more supported than our frontline associates?
By Tenure: How do employees who've been here less than a year feel compared to our veterans?
Let’s be honest, you probably already have a hunch about where the friction is. Segmentation is how you prove it. I once saw a company discover that their night-shift warehouse team was surprisingly engaged, while the daytime retail staff at a flagship store felt totally disconnected. The company-wide score was "fine," but the real, actionable story was hidden in that comparison.
The goal isn’t to find a single number that represents everyone. It's to find the specific stories hidden within the numbers so you know where to focus your attention.
Spotting Trends Over Time
The other critical piece is trend analysis. Again, this sounds more complicated than it is. It’s simply about tracking your key metrics over time to see which way they're heading. Are things getting better, worse, or staying flat?
A single data point is a snapshot. A trend is a story.
Imagine you rolled out a new training program for managers in Q2. In Q3, you see a small but steady rise in the engagement scores for the teams led by those managers. That's not just a coincidence; it's a signal that your investment is paying off. You now have solid evidence that this program is making a real difference.
On the other hand, if you see a gradual dip in your eNPS over six months, you can start digging. Did a popular leader leave? Was there a confusing policy change? The trend line doesn't give you the answer, but it tells you exactly where and when to start asking questions.
This is what makes the data human. It’s not about staring at spreadsheets until your eyes glaze over. It’s about using simple comparisons and timelines to spot patterns. It’s about turning a static report into a catalyst for a real conversation about what’s working and what isn’t.
Turning Insight Into Meaningful Action
This is where the rubber meets the road. It’s also where most engagement initiatives slowly die. You’ve collected the data, you’ve analyzed the trends, and you’ve presented the findings. Everyone nods thoughtfully, the report gets filed away, and then… crickets.
Real change only happens when you close the loop. This part is non-negotiable. It's the simple act of proving to your people that their feedback wasn't just shouted into the void.
Sharing the Good, the Bad, and the Honest
Your first move? Radical transparency. You have to share the results—the good, the bad, and the uncomfortable—with everyone. Not a watered-down, corporate-speak summary, but the real, unfiltered picture. This kind of honesty builds trust faster than any team-building exercise ever could.
We've learned that how you communicate these findings is critical. You want it to feel constructive, not accusatory. Instead of saying, “Recognition scores are low,” try framing it as, “It looks like we have an opportunity to get better at appreciating great work. What would that look like for you?”
See the difference? It’s an invitation, not an indictment. This simple shift in language changes everything.
Let Managers Lead the Conversation
Here’s a secret: the most powerful interventions are almost never massive, top-down mandates from HR. They're small, local, and team-driven. The real work of improving engagement happens at the team level, which means your managers are your most important allies.
Give them their team’s specific results—just their data, presented clearly. Then, equip them with a simple framework to have a conversation with their people. Their job isn’t to have all the answers; it’s to ask good questions.
The most effective question a manager can ask is simply: “What’s one small thing we could change that would make a real difference for our team?”
This approach puts ownership directly in the hands of the people closest to the work. One team might decide to start every shift with a five-minute huddle to improve clarity. Another might create a dedicated chat channel for celebrating small wins. These aren't huge, expensive programs; they're small, human-scale improvements that add up. This is also a perfect opportunity to turn engagement data into action that actually sticks.
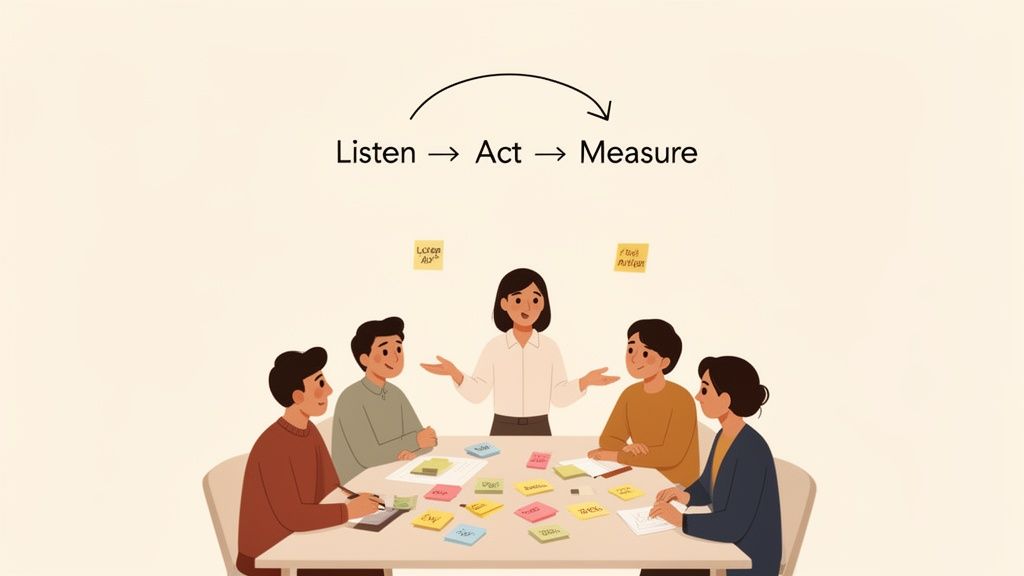
The Virtuous Cycle of Improvement
When people see their feedback lead to tangible change, no matter how small, they start to believe the process matters. You’ve just kicked off a virtuous cycle: listen, act, and measure again. The next time you send a pulse survey, they’ll be more likely to answer honestly because they know you’re truly listening.
This isn’t just about making people feel good; it’s about building a better business. When you get this right, the results are undeniable. Engaged business units consistently see 23% higher profitability, 18% higher sales, and 43% lower turnover compared to their less-engaged peers. Taking action is what unlocks this value.
Ultimately, the insights you gain should inform practical changes, like implementing effective workplace stress management strategies to support your people. This is how measuring employee engagement evolves from a reporting exercise into a core part of how your company operates. It’s about proving, through action, that every single voice truly matters.
So, What's the Real Goal of Measuring Engagement?
Let’s be honest. All this talk about measuring employee engagement—the surveys, the dashboards, the metrics—it can all start to feel like another box-ticking exercise. Another number to hit, another chart to show the board.
But if that’s how we see it, we’ve already missed the point.
The real goal isn't to get a perfect score or chase some industry benchmark. Employee engagement isn't a problem you can solve like a math equation. Think of it more like a garden. You can't just command it to grow, but you can create the conditions for it to flourish.
It’s Simply a Tool for Listening
The surveys, the data, and the analytics? They're just tools to help us listen better. They are signposts, not the destination. They exist to help us build a place where people feel seen, heard, and connected to their work and to each other.
That’s it. That’s the whole game.
When you start to see it that way, the entire process shifts. It becomes less about reporting a number and more about understanding your people. The focus moves from perfecting a score to sparking a real conversation.
I’ve learned that the most valuable outcome of measuring engagement isn’t a number. It’s the quiet, continuous improvement that happens when you truly start paying attention to what your people are telling you.
Ultimately, this isn't just about making people happier at work (though that's a great side effect). It's about building a calmer, more resilient, and fundamentally more human company. It’s a slow, deliberate process of earning and keeping trust.
It's a long game, but it’s the only one worth playing.
Got Questions About Measuring Engagement? We’ve Got Answers.
When you start digging into how to measure employee engagement, a few questions always bubble up. Let's tackle the ones I hear most often.
How Often Should We Really Be Surveying People?
First, let's agree to retire the big, clunky annual survey. It’s a dinosaur. It gives you a single snapshot in time, which is outdated almost as soon as you get the results.
A much better approach is a lightweight pulse survey—think just two to five simple questions—sent out quarterly. This gives you a living trend line of how your teams are feeling, without the survey fatigue everyone dreads.
For your frontline teams, delivery is everything. You have to meet them where they are. That means making the questions dead simple to answer on a mobile app, not some clunky desktop link they’ll never click.
Isn't Engagement Just a Fancy Word for "Happiness"?
This is a big one, and the distinction is critical. Happiness is fleeting. It's an "in the moment" feeling that can swing wildly based on whether the coffee machine is working.
Engagement, on the other hand, is a much deeper commitment. It’s the emotional and psychological connection an employee feels towards their work, their team, and the company's mission.
An engaged employee can have a tough day and still be all-in. A happy but disengaged employee might love the free snacks, but they aren't going to push through a tough project when it really matters. We’re building for commitment, not just temporary contentment.
How Can We Get Our Managers to Actually Do Something with the Results?
This is the million-dollar question, isn't it? Simply dropping a spreadsheet in their inbox and expecting miracles is a surefire way to get nothing done.
The trick is to make the data a tool for them, not a report card on them. Give them simple, clean dashboards that show only their team's results, maybe benchmarked against their own past scores.
Then, equip them to have a conversation with their team. Empower them to sit down with their people, talk it through, and co-create one or two small, achievable action items together. That’s how you get real change—from the ground up.
Ready to build a more connected, engaged, and efficient team? Pebb unifies communication, operations, and engagement into one simple app for everyone, from the front line to the front office. See how Pebb can help your teams thrive.
