
What Does Work Feel Like on a Tuesday Morning?
Uncover the real measures of employee engagement and what they reveal about your team's health, including retention, daily collaboration, and momentum.
Dan Robin

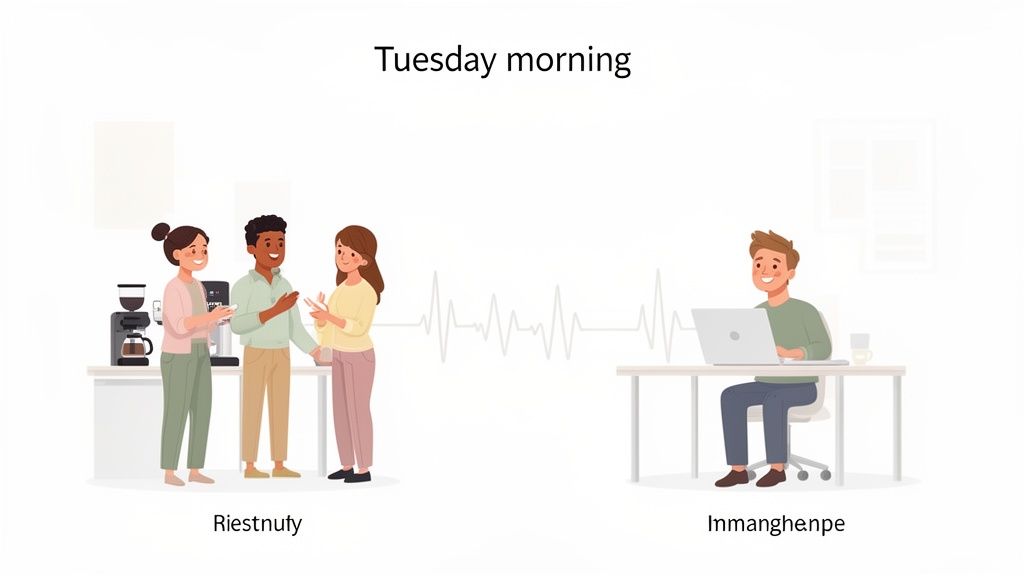
We talk a lot about "measures of employee engagement." It’s a phrase that gets tossed around in meetings until it feels like corporate jargon, scrubbed clean of any real meaning. But if you strip all that away, you’re left with a simple, human question: what does work feel like on a rainy Tuesday morning?
That’s what this is all about. Are people connected, motivated, and doing work they care about? Or are they just going through the motions?
We’ve seen firsthand that when people are genuinely connected to their work, the whole business thrives. This isn't about hitting a target for an HR report. It’s about creating a place where people want to be.
The cost of getting this wrong is staggering. In 2024, global employee engagement fell to just 21%. That slump led to an estimated $438 billion in lost productivity. That’s not a number on a spreadsheet. It’s a reflection of millions of people showing up to work without their hearts in it.
For too long, we’ve relied on the annual survey—a slow, disruptive ritual that delivers a snapshot of a moment that has already passed. By the time the data is analyzed, the feeling is gone and the opportunity is lost.
That old way is broken. It treats engagement like a one-off event instead of the living, breathing thing it is. It’s like checking your car's oil only once a year before a road trip. You miss all the slow leaks and subtle warnings that could have kept you from breaking down.
Shifting to a Real-Time View
What we need is a more honest, continuous way to understand our team’s health. That means looking beyond a single yearly score to a blend of signals that tell a richer, more accurate story. To get there, it helps to revisit the concept of employee engagement from the ground up.
At the end of the day, this is about creating a workplace where people feel seen, heard, and valued—not just during survey week, but every day. Getting that right is one of the most powerful things any leader can do.
Moving Past the Annual Engagement Survey
The annual employee engagement survey. We all know the drill. A company-wide event grinds things to a halt, only to spit out a massive report that lands on a leader’s desk weeks—or even months—later. By then, the data is a ghost. It’s a picture of a moment that’s long gone.
We think there’s a better way. The goal shouldn't be to create a perfect report once a year. It should be to build a real-time dashboard for your culture, turning a formal event into an ongoing, natural conversation.
Let’s be honest. Relying on one big survey is like trying to navigate a ship with a single, outdated map. You’d never do it. You need a mix of instruments giving you constant readings on your position, the weather, and what’s over the horizon. The same logic applies to understanding your team.
From Snapshot to Story
To get a true feel for your team’s health, you need to combine the ‘what’ with the ‘why’. Quantitative measures tell you a number went up or down; qualitative insights tell you the human story behind that number.
Some of the most powerful measures of employee engagement are beautifully simple. They don’t require a massive setup—just genuine curiosity.
First, there’s the Employee Net Promoter Score (eNPS). It’s a quick, potent metric that boils down to one question: “On a scale of 0-10, how likely are you to recommend this company as a great place to work?” It’s not the whole story, but it’s an incredible start.
Then there are Pulse Surveys. Forget the 50-question annual marathon. These are short, frequent check-ins on specific topics. They’re light enough that people actually complete them and timely enough that you can act on the feedback while it still matters.
And the ultimate reality check? Retention Rates. When your best people stick around, you’re doing something right. When they walk out the door, it’s a crystal-clear signal that something is broken.
Each of these tells a different part of the story. A high eNPS is fantastic, but if your retention rate is tanking in one department, you know exactly where to focus. You can learn more about how to make employees feel seen without forcing another survey in our guide.
The real magic happens when you stop thinking about measurement as a task and start seeing it as a conversation. Every data point is a person or a team trying to tell you something.
The best measures of employee engagement aren't the most complicated ones. They’re the ones that are easy to gather, simple to understand, and quick to act on. They give you a living, breathing view of your culture—not a dusty report collecting cobwebs on a shelf.
Hard Metrics You Can Actually Count
Data doesn’t have an opinion. While feelings and feedback are vital, sometimes you need cold, hard numbers—metrics that tell an undeniable story. These are the engagement measures you can track in a spreadsheet. They’re your reality check.
Let’s start with the big one: employee retention and turnover. When your best people consistently choose to stay, it’s the loudest signal that you’re doing something right. A high turnover rate isn’t just a statistic; it’s a smoke signal warning you of a deeper problem. It might tell you about an issue after the fact, but you absolutely cannot ignore it.
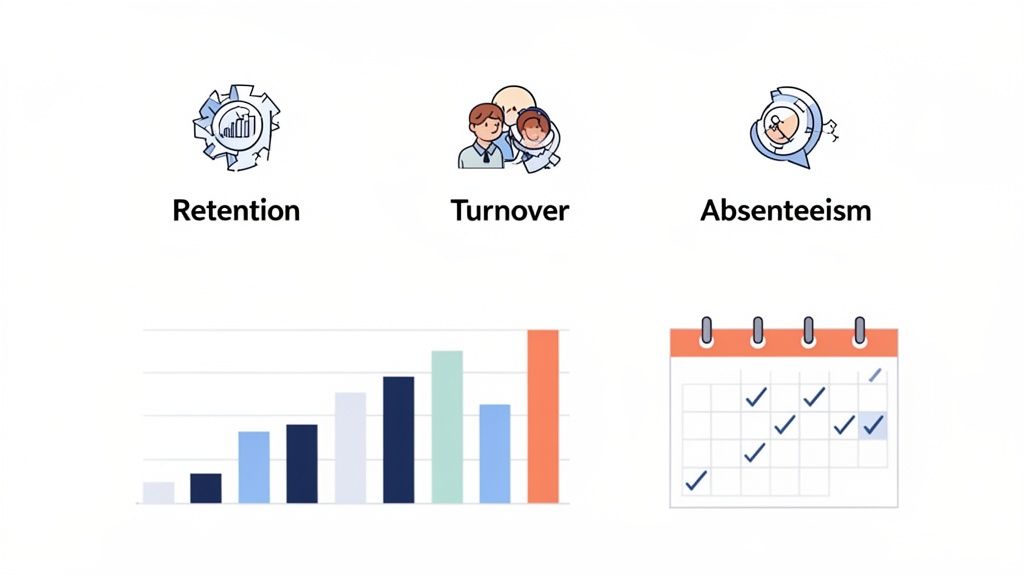
The financial hit from disengagement is staggering. It costs the global economy $7.8 trillion every year. Disengaged teams don't just feel bad; they perform poorly, with 78% more absenteeism and turnover rates up to 51% higher than their engaged peers. These aren't just HR problems—they are massive business risks. You can find more on these economic impacts at SelectSoftwareReviews.com.
Key Quantitative Measures of Employee Engagement
To get a grip on what's happening, it helps to break down the essential hard metrics. Here’s what they measure and why they’re such crucial indicators of your team's health.
Metric | What It Measures | Why It Matters |
|---|---|---|
Retention & Turnover | The rate at which employees stay with or leave the company. | High retention is a strong sign of a healthy culture. High turnover points to underlying issues that need fixing. |
Absenteeism Rate | The frequency of unplanned employee absences from work. | A spike in absenteeism can signal burnout or low morale long before people start quitting. |
Participation Rates | Engagement with company initiatives (e.g., surveys, events, internal comms). | This shows if people are actively involved or just passively showing up. Low participation means your message isn't landing. |
Recognition Frequency | How often employees give and receive praise or recognition. | This measures the flow of appreciation and collaboration. A culture of recognition is a hallmark of engaged teams. |
Tool Adoption | The usage rate of company-provided software, training, or resources. | Are people using the tools meant to help them? Low adoption suggests a disconnect or lack of buy-in. |
These numbers, looked at together, paint a far more detailed picture than any single metric could on its own.
Beyond Departures and Absences
But the story doesn't end with who leaves or who calls in sick. The best quantitative measures also track presence and participation. Think of it as measuring the "active ingredients" in your culture. Are people using the tools you provide? Are they showing up for company initiatives?
You can track things like activity in company channels, the frequency of recognition, or the adoption of new training programs. These aren't vanity metrics. They are the small, daily actions that add up to a strong, connected workplace. When you combine these hard numbers, you get a much clearer, more honest picture of what’s really going on. For a deeper dive, check out our guide on the 3 metrics that actually predict employee engagement.
Ultimately, these numbers give your intuition a backbone. They help you move from "I think we have a problem" to "I know exactly where we need to focus." And that's where real change begins.
The Human Element in Your Data
Numbers can tell you what is happening. A dip in retention is a clear signal. But numbers can’t tell you why. For that, you have to listen to the human story unfolding behind the data.
This is the qualitative side of measuring employee engagement. It’s messy, nuanced, and where the most powerful insights are hiding. It’s the difference between knowing a team’s score and understanding their mood.
We’ve found that the richest information comes from sources we often overlook. Pulse surveys are a great start, but the real texture comes from one-on-one meeting notes, the sentiment in company chat channels, and the questions people ask during all-hands meetings. These are the whispers that can prevent future shouts.
Looking at Patterns, Not Just Scores
Let's talk about manager effectiveness. You could try to boil it down to a single score, but that misses the point entirely. A better approach is to look for patterns in their behavior and their team's feedback.
Are they having regular, meaningful check-ins? Do their team members report having clear expectations? When a manager’s one-on-one notes are thoughtful and their team’s pulse responses are positive, that’s a signal of strong leadership. If a manager frequently cancels check-ins and their team seems confused, you’ve found a problem a number alone could never identify.
The goal isn't to grade your managers. It's to understand the quality of the conversations happening—or not happening—across the company. These conversations are the bedrock of engagement.
Another powerful "human metric" is recognition. How often are people giving and receiving praise? It’s easy to dismiss this as a "soft" metric, but it’s a tangible measure of your culture’s health.
When you track recognition, you’re not just counting compliments. You're measuring the flow of appreciation. A healthy flow means people feel seen and valued. A trickle suggests a culture where great work goes unnoticed, which is a fast track to burnout.
The human element also means looking at growth. Are people actually growing in their roles? Do they see a future for themselves here? An effective learning management system integration for employee development can help you track this. These qualitative measures are what separate a good workplace from a great one. They remind us that behind every data point is a person trying to do good work.
How to Connect Data to Real Insight
You’ve got the numbers. You’ve gathered the feedback. Now what? This is where most companies get stuck, staring at piles of data that don't lead to any real change. The secret isn't collecting more data; it's weaving it all together into a single, coherent story.
Data without context is just noise. But when you connect the dots between different measures of employee engagement, a clear picture emerges.
From Data Points to a Clear Story
Think of it this way: if a team’s pulse survey scores suddenly drop (a qualitative signal) and you notice their absenteeism is creeping up (a quantitative metric), you don’t have two separate problems. You have one clear signal that something is wrong. The numbers tell you what is happening, and the feedback tells you why.
This is how different human data sources—pulse surveys, one-on-one notes, recognition—can come together to give you the full picture.
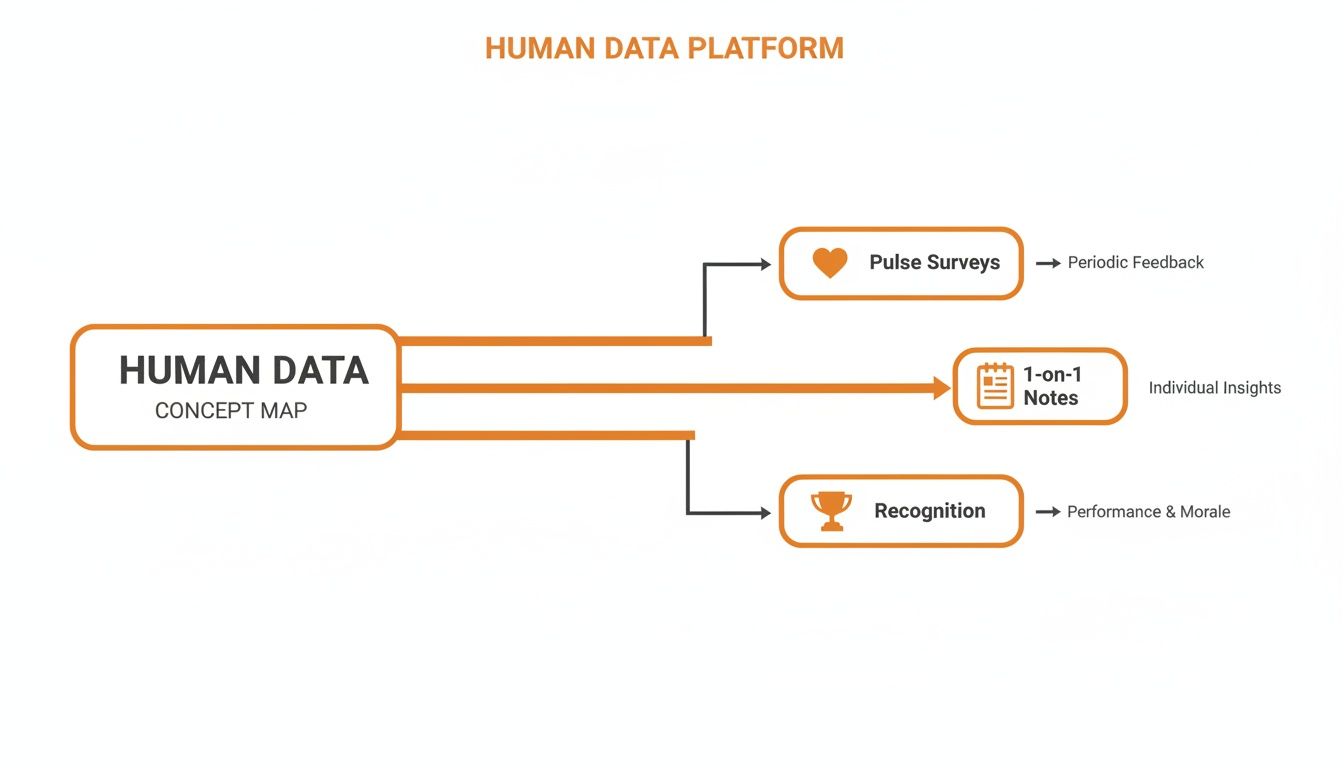
Each element provides a unique piece of the puzzle, moving from broad sentiment to specific, personal insights.
But let’s be honest. Building a complex dashboard with dozens of metrics is overwhelming. It’s also unnecessary. The goal isn’t to track everything; it’s to focus on a few key indicators that tell you the most about your team’s health.
The most powerful engagement dashboard isn't a piece of software. It’s a mindset of curiosity—a habit of asking how the numbers and the human stories connect.
So, start simple. Pick three or four metrics that matter most. You might track your eNPS score alongside voluntary turnover and the frequency of public recognition. When you see these three things together, you’ll start spotting patterns you’d otherwise miss.
Making Confident Decisions
This approach moves you from guessing to knowing. Instead of reacting to a crisis, like a star employee quitting, you can see the warning signs weeks or even months in advance. You might notice their participation in company channels has dropped off, or their manager’s one-on-one notes mention a lack of clarity.
Suddenly, you have a small window to step in and have a real conversation before it’s too late. That’s the real power of connecting your data. It’s not just about measurement; it’s about making smarter, more empathetic decisions that genuinely improve people’s lives at work.
The ultimate goal is to turn engagement data into action, building a workplace where problems are seen and solved before they escalate. It’s a continuous conversation, not a one-time report.
Spotting the Quiet Killers of Engagement
Sometimes, the most dangerous threats to a culture aren't the loud, obvious blow-ups. They’re the “quiet killers”—slow, creeping problems that are easy to overlook until they’ve done serious damage.
Think about information silos, where marketing has no clue what sales is working on. Or consider the impact of inconsistent communication, leaving everyone confused about the company's direction. And maybe the most common quiet killer of all? A total lack of a clear growth path, which makes your best people feel like they’re running in place.
These aren't just small frustrations. They're cracks forming in the foundation of your workplace culture. Left unchecked, they'll eventually lead to a major breakdown.
Learning to Read the Signs
I once worked with a company convinced everything was fine. Their turnover was stable, and their annual survey scores looked good. But when they dug deeper, they found that frontline employees couldn't name a single one of the company's strategic goals for the year. The message just wasn't landing.
This is where your employee engagement metrics stop being just numbers and start becoming detective tools.
Is participation in your company news feed tanking? That’s not a vanity metric. It’s a symptom. It might be telling you that the content is out of touch or that people have stopped trusting the source. A sudden drop in recognition between departments could be a warning sign that those information silos are getting worse.
The key is to connect these subtle issues directly to your metrics. You have to train yourself to see the early warning signs in the data before they spiral into crises. For instance, you could track:
Communication clarity: Are people reading and reacting to strategic updates? If not, why?
Cross-team collaboration: How often are people from different teams giving each other kudos? If that number slides, you know you have a problem.
Growth conversations: Are managers talking about career paths in their one-on-ones? A quick look at their notes can tell you.
Spotting these quiet killers isn’t about cramming more charts onto your dashboard. It's about getting curious and asking what the numbers are really telling you about the human experience at your company. It’s about learning to hear the whispers before they turn into shouts.
Frequently Asked Questions
Got questions about measuring employee engagement? Good. Here are a few common ones we hear.
How Often Should We Measure Employee Engagement?
Let’s be honest: the old way of doing one massive survey every year is broken. It's too slow. By the time you get the data, it's already stale.
We believe in a much steadier rhythm.
Think smaller, lighter, and more frequent. Quick pulse surveys sent out quarterly, or even monthly, give you a real-time feel for what's happening right now. For other things like participation or recognition rates, you should be glancing at that data continuously. The goal is to create a steady stream of insight, not a once-a-year data dump.
What Is the Single Most Important Measure?
This is a trick question. The truth is, there isn't one.
Relying on a single metric, like eNPS, is a mistake. It oversimplifies a complex, human issue. It’s like judging a restaurant only by its star rating without reading the reviews to see what people actually said. You miss the whole story.
A much healthier approach is to look at a small cluster of metrics together. This ‘triangle’ of data gives you a more balanced and accurate picture of what's really going on.
For example, try looking at a pulse survey score alongside your voluntary turnover rate and participation in company programs. When you see all three moving in the same direction, you can be confident you’re seeing a real trend, not just a random blip on the radar.
How Does a Tool Help with These Measures?
The biggest challenge with engagement data isn't a lack of it; it’s that it’s scattered all over the place. Your recognition data is in one system, your survey results in another, and your communication stats are somewhere else entirely. This is where a good tool changes the game.
It brings all the activities that signal engagement—communication, recognition, collaboration—into one central hub.
This means you can spot patterns as they happen, without having to duct-tape a dozen different reports together. You stop just 'measuring' engagement and start actually observing how your team connects and works, with all the data right there at your fingertips.
At Pebb, we built our platform to put all these human signals in one place, helping you see the full story of your team’s engagement. Learn how Pebb can help you move from messy data to clear insight.
