

Author: Ron Daniel
Common Engagement Metrics and How to Use Them
Five essential employee engagement metrics, formulas, benchmarks, and practical steps to measure and act to improve retention and alignment.
Let me ask you something: how many times have you rolled out an employee survey, and considered the role of employee surveys in your overall strategy, only to wonder if the results actually mean anything? I’ve been there. A few years ago, I sat in a meeting where we reviewed engagement numbers that looked... fine. But here’s the kicker: a month later, we lost three key team members, and no one saw it coming. That was the moment I realized we weren’t just missing the signs - we weren’t even looking in the right places.
Here’s the truth: engagement metrics are more than just numbers on a dashboard. They’re a window into how connected, aligned, and motivated your team really is. And when you get it right, the payoff is massive. Higher retention. Better customer experiences. Teams that actually want to show up and do great work. But tracking engagement the wrong way? That’s a fast track to survey fatigue, missed opportunities, and a team that feels unheard.
So, how do you measure engagement in a way that actually works? That’s what I’m here to share. Let’s break down the five metrics that matter most and how we use them at Pebb to keep teams on track - and thriving.
5 Engagement Metrics You Need to Track
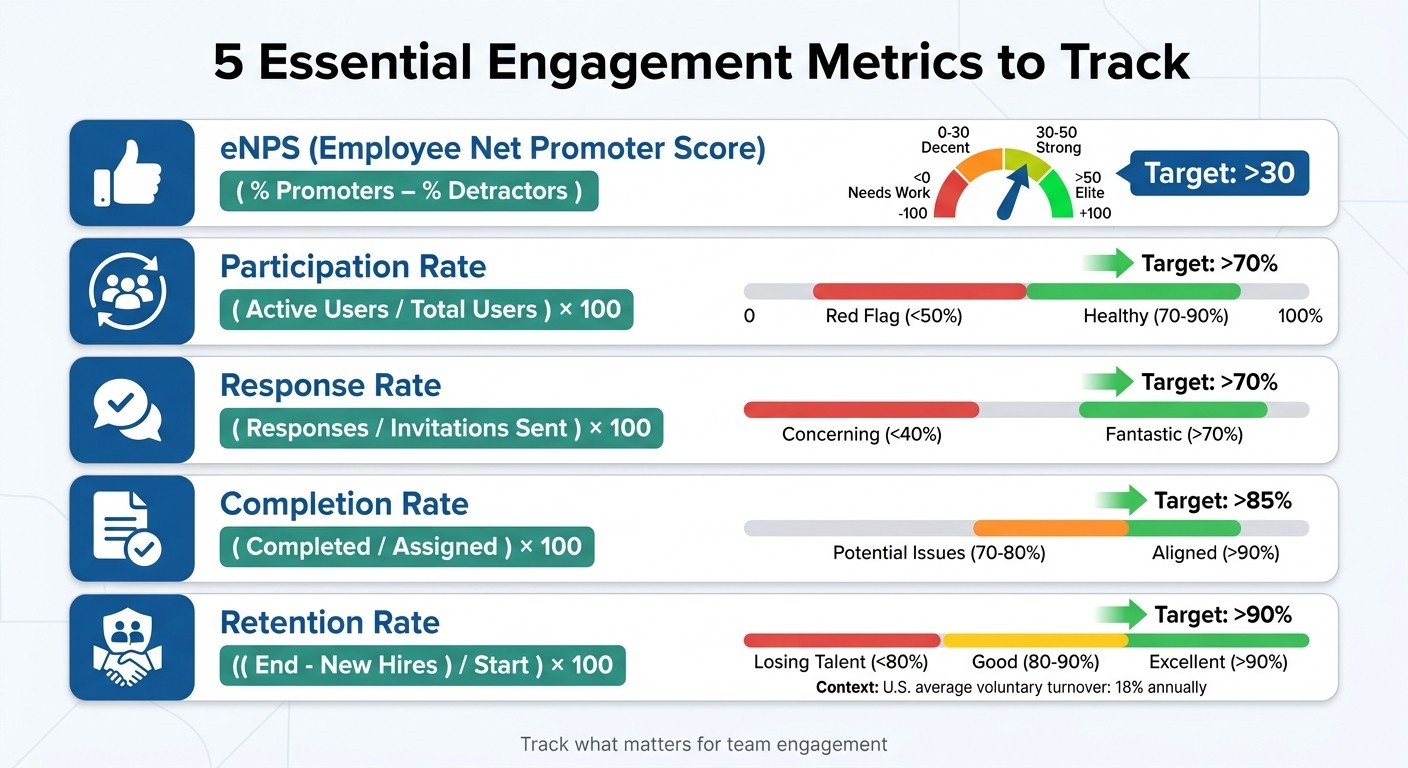
5 Essential Employee Engagement Metrics: Formulas and Benchmarks
Let’s talk about the numbers that tell the real story of your team’s engagement. At Pebb.io, we’ve seen firsthand how tracking the right metrics can reveal whether your team feels connected, aligned, and ready to stick around - or if they’re quietly disengaging. Here are five metrics we swear by, and why they matter.
eNPS (Employee Net Promoter Score)
Think of eNPS as your loyalty barometer. It’s based on one straightforward question: “On a scale of 0-10, how likely are you to recommend this company as a place to work?” Here’s how the responses break down:
Promoters (scores of 9–10): Your cheerleaders.
Passives (scores of 7–8): Satisfied but not enthusiastic.
Detractors (scores of 0–6): Unhappy campers.
The formula is simple: (% Promoters - % Detractors), giving you a score between –100 and 100.
A score above 50? That’s elite territory - think Google-level engagement. Scores between 30–50 are strong, 0–30 are decent, and anything below zero signals you’ve got work to do. To give you an example, one of our retail clients jumped from 12 to 48 after introducing monthly pulse surveys through Pebb. Not only did their eNPS soar, but team collaboration in chats also climbed by 25%.
With Pebb, setting up these quick surveys is a breeze. Employees can respond directly in the app - no extra logins, no fuss. Plus, the data lands instantly in your dashboard, ready for action. The key? Don’t just track the numbers - act on them.
Participation Rate
This metric is all about engagement with your communications. It’s the percentage of team members actively interacting with things like app updates, news posts, or polls. The formula? (Number of unique active employees / Total employees) × 100.
For frontline teams, a healthy participation rate ranges from 70–90%. Anything below 50%? That’s a red flag. It could mean your messages aren’t landing or your tools are too scattered.
Pebb makes it easy to track participation automatically. You’ll see insights like “85% participation in last week’s polls” or “Only 42% viewed the safety update post.” If you spot a dip, you can dig deeper - maybe night shift workers aren’t getting notified, or the content isn’t resonating. Real-time tracking means you can fix issues before they snowball.
Response Rate
While participation shows who’s paying attention, response rate measures who’s actually speaking up. It’s calculated as (Number of responses / Number of invitations sent) × 100.
A response rate over 70% is fantastic - it shows employees believe their input matters. Anything under 40%? That’s a sign of survey fatigue or, worse, a lack of trust that their feedback will lead to change.
Pebb simplifies this with built-in digital forms and gentle reminders like “Don’t forget to complete the survey by Friday!” Our clients regularly hit 80%+ response rates because the process is seamless. The golden rule? Keep surveys short, mobile-friendly, and always follow up with action. If employees see their feedback leading to real changes, they’ll keep engaging.
Completion Rate
This metric goes beyond communication to measure operational alignment. It tracks whether tasks and shifts are being completed: (Completed tasks or shifts / Assigned tasks or shifts) × 100.
A completion rate above 90% means your team is aligned and delivering. Rates between 70–80%? That could signal unclear instructions, training gaps, or overwhelmed team members.
With Pebb, completion rates are tracked automatically. For instance, one client saw shift completion jump from 75% to 92% after adding automated reminders. If rates suddenly drop, it’s often an early warning sign - maybe a department is understaffed, or a new process wasn’t explained well. Catching these issues early can save you from bigger problems down the road.
Retention Rate
Finally, the ultimate measure of engagement: retention rate. This shows how many employees stick around over time: ((Employees at end of period - New hires) / Employees at start) × 100.
Here’s the breakdown:
90%+: Excellent.
80–90%: Good.
Below 80%: You’re losing talent faster than you should.
The U.S. average for voluntary turnover is around 18% annually, making strategies for reducing employee turnover a top priority for HR leaders. If you’re retaining 85–90% of your team year after year, you’re ahead of the game. One of our clients noticed a Q2 turnover spike and used Pebb’s analytics to dig deeper. The culprit? Denied vacation requests. After tweaking their approval process, turnover dropped by 18% the following year.
Pebb also helps uncover hidden patterns - like how low PTO usage can signal burnout. Spotting these trends early lets you act before good employees decide to leave.
Metric | Formula | Target Benchmark |
|---|---|---|
eNPS | (% Promoters - % Detractors) | >30 |
Participation Rate | (Active Users / Total Users) × 100 | >70% |
Response Rate | (Responses / Invitations Sent) × 100 | >70% |
Completion Rate | (Completed / Assigned) × 100 | >85% |
Retention Rate | ((End - New Hires) / Start) × 100 | >90% |
How to Use Metrics to Improve Team Alignment
Let me share something I've learned at Pebb: tracking metrics is just the beginning. The real game-changer is using those numbers to bring your team together. Over time, we've seen how turning data into action can completely shift engagement levels. Here’s how we make it happen.
Set Benchmarks and Goals
First things first, you need to define what success looks like. Set clear targets based on industry benchmarks and your own team’s history. For example, if your employee net promoter score (eNPS) is lower than you'd like, aim for gradual, steady improvements instead of expecting overnight miracles.
What’s key here is tailoring goals to specific roles. A warehouse worker’s engagement priorities are bound to differ from those of a marketing manager sitting at a desk. By setting role-specific targets, everyone knows what success means for their job. And pay attention to trends - if long-term employees rate their experience higher than new hires, that could point to issues with frontline employee onboarding.
Automate Data Collection
Let’s be honest: nobody wants to deal with endless spreadsheets or email surveys. Not only is it exhausting, but the data you get can be inconsistent. That’s why we built Pebb to handle this seamlessly. Our real-time dashboard keeps tabs on participation, responses, and completion rates automatically. No more chasing after data - it’s all right there when you need it.
Here’s an example: the dashboard can show you how many employees viewed an important update or completed a survey. If you notice participation dropping, it’s a sign to dig deeper. Maybe the content isn’t engaging enough, or notifications aren’t getting through. Either way, you’ll know right away instead of finding out when it’s too late.
Act on Your Data
Here’s the thing: metrics are useless if you don’t act on them. If participation is low, find out why. Are notifications being missed? Do employees feel like their input doesn’t matter? Don’t just shrug and move on - use the data as a conversation starter.
For example, if your eNPS scores show a disconnect, start discussions with your team to uncover the root cause. One strategy we’ve found incredibly effective is conducting “stay” interviews with top performers. Instead of waiting for exit interviews, ask your best employees what keeps them engaged. Their insights can help you realign teams that might be struggling.
And when employees see their feedback leading to actual changes - like better shift schedules, clearer communication, or faster PTO approvals - they’ll stay more engaged. That’s when those metrics stop being just numbers and start driving meaningful alignment. Trust me, I’ve seen it happen again and again with teams that switch to Pebb.
Example: How One Company Improved Engagement with Pebb
Before: Disconnected Tools and Low Engagement
Let me share a story about a mid-sized retail chain we worked with in early 2025. They had 180 employees spread across seven locations, and things weren’t going smoothly. Store managers juggled WhatsApp for shift changes, email for company-wide announcements, and paper forms for PTO requests. Meanwhile, the corporate team relied on Slack - something frontline workers couldn’t even use during their shifts. It was a mess.
The result? Only 22% of employees were engaging with company updates, and their employee net promoter score (eNPS) sat at a dismal -15. Leadership felt out of touch, and managers wasted hours each week just trying to figure out who had seen critical messages. New hires were struggling, too - just 68% stuck around past the 90-day mark, far below the industry norm. The HR director admitted they were overwhelmed and didn’t know where to begin. It was clear they needed help, and that’s where Pebb came into the picture.
After: Better Results with Pebb
Fast forward three months, and the transformation was incredible. Their participation rate skyrocketed to 78%, thanks to Pebb’s unified platform that let everyone - from stockroom staff to district managers - stay connected in real time. Even their eNPS score saw a massive leap, climbing 47 points to +32. Seeing those numbers felt like a win not just for them but for us, too.
Here’s what changed:
They used Pebb’s shift scheduling and PTO management tools to cut out the endless back-and-forth.
Weekly recognition posts and polls brought employees together and boosted morale.
Our real-time analytics dashboard helped them pinpoint and fix engagement issues at specific locations.
The results spoke for themselves. Their 90-day retention rate improved to 84%, and managers saved an average of 6 hours each week on admin tasks. It’s stories like this that remind me why we created Pebb - to make work life simpler and more connected for everyone involved.
Conclusion
What to Remember
After diving into the key metrics that influence team alignment, let’s recap the essentials. Tracking engagement doesn’t have to be complicated if you’ve got the right tools in place. Here’s the breakdown:
eNPS reflects loyalty and how likely employees are to recommend your workplace.
Participation, response, and completion rates give you a clear picture of how effective your communication is.
Retention rates reveal the overall health of engagement within your team.
The magic happens when you look at these metrics together. For example, low participation paired with high retention might signal that your internal communications strategy needs a tune-up. But low participation and low retention? That points to deeper, more urgent issues within your team that require immediate attention.
Why Pebb Works for Engagement Tracking
Here’s where Pebb comes in. We know the challenges you face because we’ve been there. That’s why we created a platform that simplifies engagement tracking by bringing everything into one place.
Imagine this: shift schedules, company updates, PTO requests, recognition posts, inspired by internal communication examples, and real-time analytics - all housed under one roof. No more bouncing between five different tools or crunching numbers manually. With Pebb’s dashboard, you’ll instantly see what’s working and what’s not, whether you’re leading a local restaurant team or managing a remote sales crew.
And the best part? It’s affordable. At just $4 per user (and free for teams under 15), you’re getting access to analytics that were once reserved for massive enterprise budgets. Everyone, from frontline workers to executives, gets the same visibility into engagement efforts. And when your team can see the impact of their work in real time, it’s a game-changer.
With Pebb, tracking these critical metrics isn’t just easy - it’s a step toward creating the meaningful changes your team deserves.
FAQs
How often should I track engagement metrics?
Tracking engagement metrics regularly is like keeping your finger on the pulse of your team. Many companies check these numbers either continuously or on a monthly basis. Why? Because staying on top of trends allows you to act quickly when something feels off. It’s all about staying connected to your team’s needs and making sure engagement levels don’t slip through the cracks.
Which engagement metric should I address first?
Start with the metric that has the biggest influence on your team’s performance and communication. For many, that’s overall employee engagement - things like how often people participate in communication tools or provide feedback. If your team works remotely, pay close attention to metrics like virtual participation. Tackling the largest gap first often creates a ripple effect, boosting other areas and keeping your team aligned and motivated.
How do I improve low survey response without annoying employees?
Improving low survey response rates starts with simplicity and purpose. Keep your surveys short - nobody wants to spend 20 minutes answering endless questions. Focus on what really matters, and be upfront about why their feedback is important. People are far more likely to engage when they see how their input drives real changes.
At Pebb, we’ve made it a priority to integrate feedback into everyday communication. Tools like ours make it easy for employees to share their thoughts without disrupting their workflow. And here’s a golden rule: always thank your team for taking the time to participate. A little gratitude goes a long way in building trust, reducing survey fatigue, and encouraging them to keep sharing in the future.
