
8 Staff Engagement Measures We Actually Use
Go beyond surveys. Discover 8 staff engagement measures that provide real insight and help build a culture people won't want to leave.
Dan Robin

We used to think we had a handle on team morale. A good vibe in the office, a few laughs in chat—that meant everyone was engaged, right? Wrong. The truth is, engagement isn't a feeling you can guess; it’s a condition you have to measure.
For years, we relied on the annual survey. It was a single data point that felt outdated the moment we got the results. Like trying to navigate a road trip using a photo of a map taken last year. It told us where we'd been, not where we were going or why we were stuck in traffic. To truly stop guessing and start measuring, understanding the importance of adopting people analytics is the first step.
Let’s be honest: most staff engagement measures feel like corporate theater. They produce charts nobody acts on and create more cynicism than clarity. So we decided to do it differently. We went searching for measures that gave us real-time, human-scale insights—things that told a story and prompted a conversation, not just a dashboard update.
This isn't a theoretical list. It's what we’ve tested, debated, and ultimately put to work. We’ll cover everything from the classic eNPS to more conversational tools like Stay Interviews. Some are simple, others are more involved, but all of them get you closer to the truth. And the truth, we’ve found, is the only place to start.
1. Employee Net Promoter Score (eNPS)
If you could only ask one question, what would it be? The Employee Net Promoter Score (eNPS) offers a simple but potent one: "On a scale of 0-10, how likely are you to recommend our company as a great place to work?" Adapted from the customer-focused metric, it’s one of the most direct staff engagement measures out there. It cuts through the noise and gives you a single, clear number.
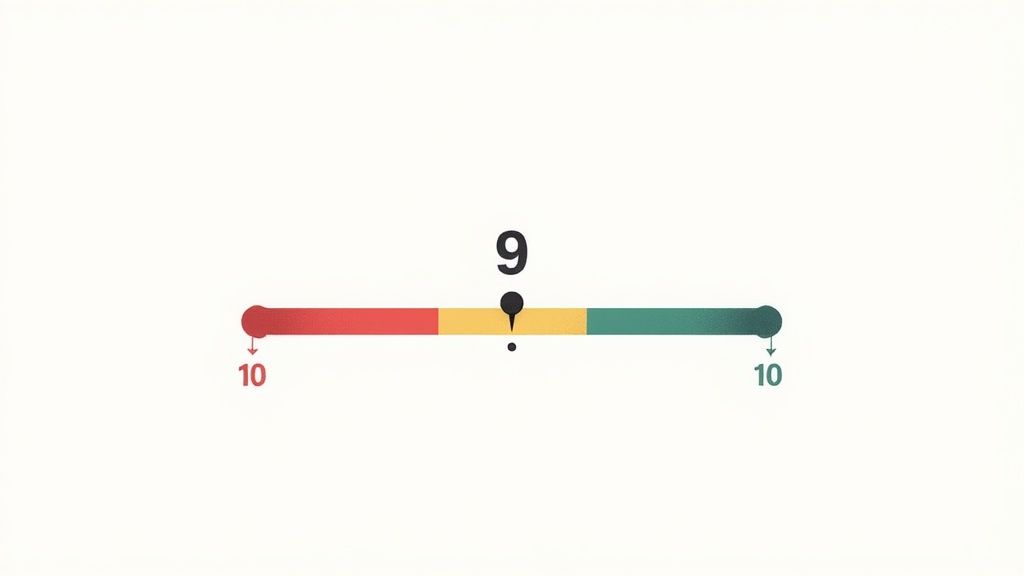
The math is simple. Employees are grouped based on their 0-10 score:
Promoters (9-10): Your advocates. They're happy, engaged, and championing your workplace.
Passives (7-8): They're content, but not enthusiastic. They do the work but aren't invested.
Detractors (0-6): They're unhappy, at risk of leaving, and might be spreading negativity.
Your eNPS score is simply the percentage of Promoters minus the percentage of Detractors. A score can range from -100 to +100. If you have 40% Promoters and 15% Detractors, your score is +25.
Why It's a Go-To Metric
The beauty of eNPS is its simplicity. Companies like Google and Salesforce use it for a regular pulse check without causing survey fatigue. It's a high-level sign that tells you if you're generally moving in the right direction. A rising score suggests things are working; a dip signals it's time to dig deeper.
Making eNPS Work for You
But a number alone is just data. The real value is what you do next.
Always ask "Why?": Pair the scoring question with an open-ended one, like "What’s the main reason for your score?" The real insights are in these answers.
Segment your data: A company-wide score of +30 can hide a department at -20. Break results down by team, location, and tenure to find the real pain points.
Act and communicate: Share the results. More importantly, show you’re acting on the feedback. Nothing kills engagement faster than asking for opinions and then ignoring them.
2. Pulse Surveys
If the annual survey is a yearly physical, pulse surveys are the weekly check-in on your company's heart rate. They are short, frequent surveys—usually 5-10 questions—sent out weekly or monthly. Unlike a deep dive, they capture a real-time snapshot of employee sentiment, making them one of the most agile staff engagement measures you can use.
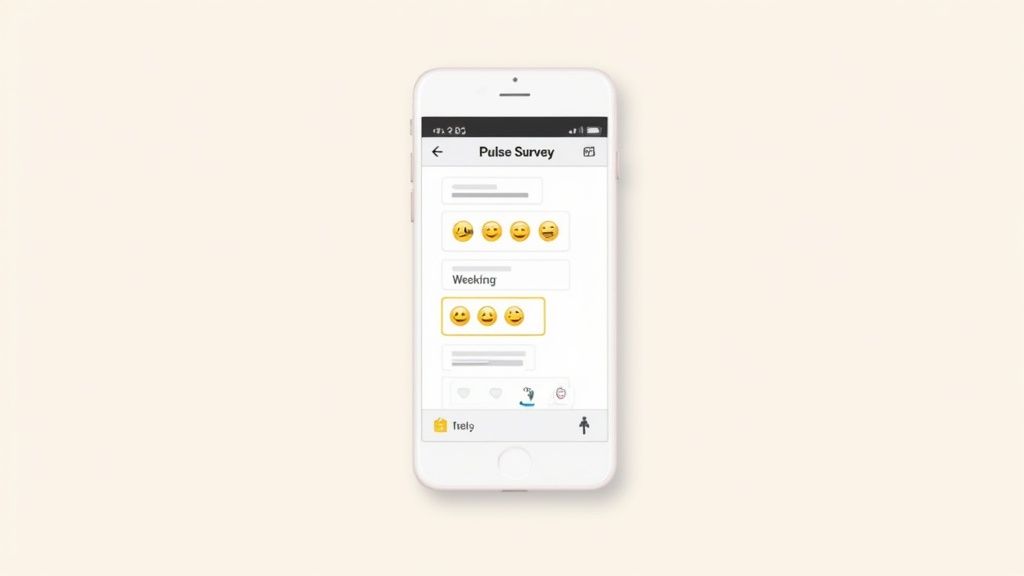
The idea is simple: instead of waiting a year to find a problem, you can spot and address issues as they come up. Questions are targeted and can rotate to cover different topics. One week might be about manager support, the next on work-life balance. This creates a continuous feedback loop that feels responsive.
You get a mix of hard numbers and written feedback. The magic happens when you track these trends over time. You can see the direct impact of a new initiative, a leadership change, or an external event on your team's morale.
Why It's a Go-To Metric
Pulse surveys work because they're low-effort for employees and give high-impact, timely data to leaders. Companies like Microsoft and Uber use them to monitor team health globally without the fatigue. It lets them move from reacting to year-old problems to proactively shaping the employee experience week by week. Feedback becomes a normal part of the rhythm, not a dreaded annual event.
Making Pulse Surveys Work for You
A stream of data is useless without a plan. To make pulse surveys work, you need discipline.
Keep it short: Stick to 5-10 questions, max. The goal is a quick check, not a full diagnostic. This keeps response rates high.
Close the loop, fast: This is critical. Share findings with the team quickly and say what you’re doing about it. Seeing their feedback lead to change is the single biggest driver for them to keep participating.
Segment your data: A company-wide score can mask serious issues. Analyze results by team or department to find hotspots where leaders may need support.
Act on what you learn: Pulse surveys are a commitment to action. If you're not ready to act on the feedback, it's better not to ask. There are other ways to truly understand and boost team engagement.
3. Gallup Q12 Assessment
What if you could measure engagement by asking just 12 powerful questions? That's the promise of the Gallup Q12. It isn't just a survey; it's a diagnostic tool, developed over decades, designed to pinpoint what drives performance at the team level. It moves beyond a simple happiness score to uncover whether people have what they need to do great work.
The Q12 asks employees to rate 12 statements on a 5-point scale, from "Strongly Disagree" to "Strongly Agree." These questions get to the heart of what really matters:
Do I know what is expected of me at work?
Do I have the materials and equipment I need to do my work right?
At work, do I have the opportunity to do what I do best every day?
In the last seven days, have I received recognition or praise for doing good work?
Does my supervisor, or someone at work, seem to care about me as a person?
These questions focus on fundamental needs like clarity, resources, recognition, and development. They’re proven to link to business outcomes like productivity and profitability, making the Q12 one of the most respected staff engagement measures available.
Why It's a Go-To Metric
The strength of the Q12 is its focus on what managers can directly influence. A CEO can't personally engage everyone, but a manager can ensure their people have clear expectations. Companies like Marriott and Best Buy use it to help local leaders. For example, Best Buy linked higher Q12 scores to lower employee turnover. It shifts the conversation from a vague idea of "engagement" to concrete actions a manager can take tomorrow.
Making the Q12 Work for You
The Q12 is most powerful when it sparks conversation and action on a team, not just a company-wide report.
Focus on the team: The real magic happens when managers review their team’s results and talk openly about the lowest-scoring areas.
Create action plans: Don't just admire the data. Help managers create action plans with their teams to improve one or two key areas.
Train your managers: Give managers coaching on how to read their results and lead good follow-up conversations. The goal is help, not judgment.
Connect to business outcomes: Show the link between teams with high Q12 scores and their performance. This shows the return on investing in engagement.
4. 360-Degree Feedback
How can a manager know their impact if they only get feedback from their boss? 360-Degree Feedback flips that on its head. It gathers anonymous feedback from a person's manager, peers, and direct reports. This holistic view provides one of the most comprehensive staff engagement measures by revealing how someone's behavior is seen from every angle.
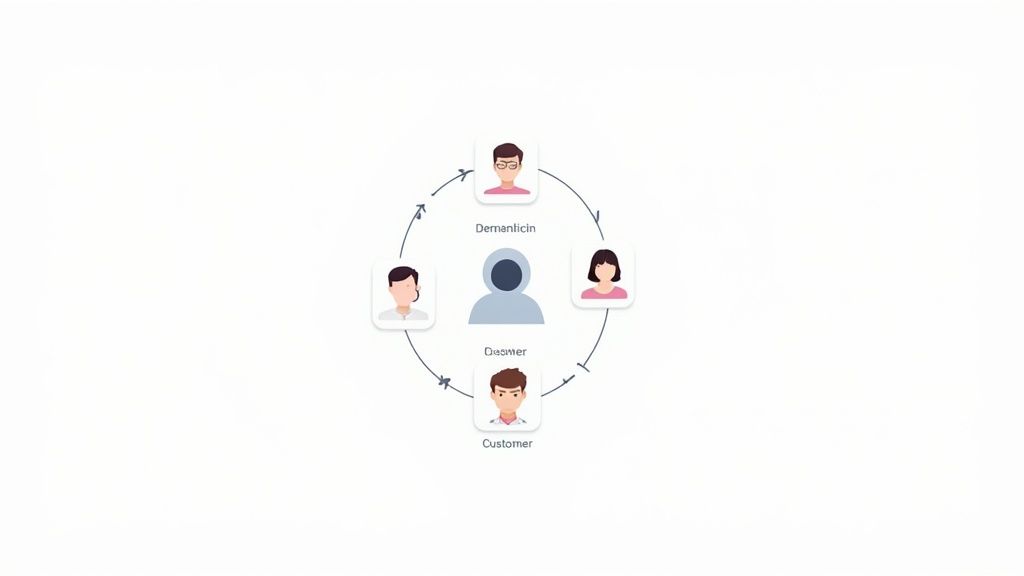
Here’s how it works. A small group of colleagues anonymously answers a questionnaire about someone's skills, like communication or leadership. The answers are compiled into a report that highlights strengths and, crucially, blind spots. The point isn't to blame; it's to build self-awareness. The feedback looks at patterns like:
Leadership impact: How do direct reports feel about their manager's guidance?
Peer collaboration: Is this person seen as a helpful teammate?
Upward management: Do they communicate well with their own boss?
The result is a rich picture of how someone contributes to the team's culture, moving beyond simple output.
Why It's a Go-To Metric
360-Degree Feedback uncovers the "how" behind the "what." A top salesperson might hit their targets, but this feedback could reveal they’re hurting team morale to do it. Companies like Google and Deloitte use it to develop self-aware leaders who build engaged teams. It directly links individual behavior to collective engagement.
Making 360-Degree Feedback Work for You
This isn't for performance reviews or pay decisions. It’s a development tool, and its success hinges on trust.
Focus on development, not judgment: Frame the whole thing as a growth opportunity. The goal is to build skills, not find fault. A professional coach can make a huge difference here.
Ensure anonymity: People will only be honest if they feel safe. Guaranteeing confidentiality is non-negotiable.
Make it actionable: The report is just the start. Help the person choose two or three specific behaviors to work on. Overwhelming them is a recipe for inaction. Follow up in 6-12 months to see progress.
5. Stay Interviews
If you could stop your best people from even thinking about leaving, what would you ask them? Stay interviews flip the script on the exit interview. Instead of asking why people are leaving, they focus on why your best people stay. This is one of the most powerful and personal staff engagement measures because it’s a direct conversation about what truly matters.
Here’s the simple idea. You sit down for a structured, one-on-one chat with a current employee to understand what keeps them here. The goal isn't to talk about projects; it's to uncover what makes their job great and identify potential issues before they become reasons to quit.
The conversation is guided by a few core questions:
Motivators: "What do you look forward to when you come to work?"
Engagement drivers: "What parts of your job make you feel energized?"
Retention risks: "What might tempt you to leave?"
Improvement areas: "If you had a magic wand, what's one thing you would change?"
These conversations give you rich, human data that a survey could never capture. You're not just getting a score; you're getting the story behind it.
Why It's a Go-To Metric
The power of stay interviews is that they're proactive and build trust. Companies like Microsoft use them to spot team health issues early and keep their critical talent. The Society for Human Resource Management (SHRM) found that companies using them can see a 10-15% jump in retention. It turns engagement from a reactive metric into a forward-looking strategy.
Making Stay Interviews Work for You
A conversation is only as good as the action that follows. To get real value, you need a plan.
Be strategic: Start with your high-performers and people in hard-to-fill roles. Their insights tell you what you're doing right and where you're vulnerable.
Ask open-ended questions: Avoid "yes" or "no" questions. You want them to talk. Ask, "Tell me about a time you felt really proud of your work here."
Listen for themes, not tasks: Don’t treat it like a fix-it list. Listen for patterns across interviews. If multiple people mention a lack of growth, that’s your signal to act systemically.
Close the loop: This is the most crucial step. Share anonymized themes with the team and communicate the actions you’re taking. Proving you listened builds incredible trust.
6. Absenteeism and Presenteeism Metrics
What if your team is telling you they're disengaged without saying a word? Sometimes the most powerful staff engagement measures aren't in a survey but in attendance records. Tracking absenteeism (unplanned time away) and presenteeism (being physically present but mentally checked out) gives you a hard look at your workplace's health. High rates of either are a clear signal something is wrong.
Absenteeism is easy to track, but presenteeism is its sneakier, more expensive sibling. A recent UK study found that disengaged employees cost the economy £340 billion a year in lost productivity, much of that from people just going through the motions. These aren't just numbers; they represent people struggling to connect with their work.
Here’s how to frame these metrics:
Absenteeism rate: This is the classic calculation—the total unplanned absence days divided by the total workdays in a period, times 100.
Presenteeism indicators: This is harder to measure but you can see the signs. Look for drops in productivity, missed deadlines, or lower quality work.
The goal isn't just to count sick days, but to understand the "why" behind them.
Why It's a Go-To Metric
These metrics connect engagement directly to your bottom line. They're undeniable. When Johnson & Johnson linked wellness programs to a 27% drop in absenteeism, it wasn't a feeling; it was a measurable business impact. This kind of data gives HR a powerful voice in strategic talks.
Making These Metrics Work for You
Tracking these numbers is the first step. Turning them into action is what matters.
Look for patterns: Don't just look at the overall rate. Are absences spiking on Mondays? Is one specific team showing a drop in output? Digging into the data reveals where the real problems are.
Connect the dots: Lay your absenteeism data over your engagement survey results. You'll likely find that teams with the lowest engagement also have the highest absence rates. This correlation is your leverage for change.
Train your managers: Help managers hold regular, meaningful one-on-ones. These conversations often reveal the root causes of absence, like burnout or lack of support. This is how you start turning your engagement data into action.
Think flexibly: Rigid work structures often make both problems worse. Offering flexible work can reduce the pressure that leads people to call out sick or show up unable to perform.
7. Employee Turnover and Retention Analytics
Happy, engaged employees don't usually leave. Unhappy, disengaged ones do. That’s why tracking who is leaving, when, and why is one of the most powerful staff engagement measures there is. High turnover is a flashing red light on your company dashboard, signaling that something is fundamentally broken. It’s the financial and cultural cost of poor engagement.
This goes beyond just counting heads. Real retention analytics means digging into who is leaving. You need to separate voluntary from involuntary turnover and, more importantly, "regrettable" turnover—when a high-performer walks out the door. The goal is to move from reacting when someone quits to proactively understanding the root causes.
Here’s how to start measuring it well:
Voluntary Turnover Rate: (Number of Voluntary Departures / Average Number of Employees) x 100. This is your core metric.
Regrettable Turnover Rate: (Number of High-Performer Departures / Total Voluntary Departures) x 100. This measures the loss of your best talent.
Cost of Turnover: A conservative estimate is 50-200% of an employee’s annual salary, factoring in recruitment, onboarding, and lost productivity.
Why It's a Go-To Metric
Turnover analytics provide hard, financial proof of engagement's impact. Companies like Google don't just track this data; they act on it. A famous Google study found that better managers directly led to a 37% reduction in team turnover. Gallup research consistently shows that business units with top-quartile engagement see significantly lower turnover. This isn’t a soft metric; it hits the bottom line.
Making Turnover Analytics Work for You
Raw numbers are just the start. The real value is turning data into retention strategies.
Segment your data: Don't stop at a company-wide number. Analyze turnover by manager, department, and tenure (especially the first 90 days). LinkedIn talent data shows that managers are the single biggest driver of variance in team turnover.
Mine your exit interviews: Go beyond the checklist. Look for recurring themes. Are people leaving for better pay, poor management, or lack of growth? This is your roadmap for change.
Implement "stay" interviews: Don't wait for people to resign. Regularly talk with your top performers to understand what keeps them here and what might cause them to look elsewhere.
Address root causes: Tracking turnover is one thing; fixing it is another. Implementing effective workplace stress management strategies can make a big difference. And solid internal communication is vital; you can learn more about turning communication into a retention tool.
8. Focus Groups and Engagement Workshops
Sometimes a survey score tells you what is happening, but it can’t tell you why. When you need to understand the stories and context behind the numbers, it's time to bring people together. Focus groups and workshops are qualitative staff engagement measures designed for deep, meaningful conversations. They aren't just meetings; they are structured discussions that uncover the nuances of the employee experience.
Instead of a survey, a focus group brings a small group of employees (typically 8-12) into a room with a skilled facilitator. The goal is to explore a specific topic, like the results of a recent survey. It’s about creating a safe space where people feel comfortable sharing honest, unfiltered thoughts.
Here’s how it works:
A facilitator guides the conversation with open-ended questions.
Participants build on each other's ideas, creating a rich picture of shared experiences.
The focus is on "why" and "how," not just "what." You're digging for root causes and brainstorming solutions together.
The result is a wealth of human context that adds color to your data. It turns a flat eNPS score of -10 in engineering into a clear understanding of frustrations with legacy software.
Why It's a Go-To Metric
While surveys provide scale, focus groups provide depth. Companies like Southwest Airlines use them to ensure their legendary service culture is truly felt by employees, not just marketed to customers. It’s a way to co-create culture rather than imposing it from the top down.
Making Focus Groups Work for You
The power of this approach is in the execution. Done poorly, it feels like a waste of time. Done well, it can be transformative.
Ensure psychological safety: An external facilitator is often best. They create a neutral space where employees can speak freely without fear of reprisal.
Use structured activities: Techniques like asking what the team should "start, stop, and continue" doing can surface clear, actionable ideas.
Don't just listen—act: The process doesn't end when the session is over. Share key themes with participants and create a visible action plan. Nothing builds trust faster than showing your team you heard them and are taking what they said seriously.
8-Point Staff Engagement Measures Comparison
Method | 🔄 Implementation complexity | ⚡ Resource requirements | 📊 Expected outcomes | 💡 Ideal use cases | ⭐ Key advantages |
|---|---|---|---|---|---|
Employee Net Promoter Score (eNPS) | Very low — single 0–10 question, simple admin | Very low — basic survey tool, minimal analysis | Numeric score (-100 to +100) for trend and retention signal | Quick health checks, frequent benchmarking, orgwide pulse | Fast, low-cost, easy to track over time |
Pulse Surveys | Low–medium — recurring micro-surveys and cadence design | Medium — survey platform, cadence management, reporting | Near real-time sentiment trends and early warning signals | Monitor team health, project phases, rapid-response needs | Timely, flexible, higher response rates |
Gallup Q12 Assessment | Medium — licensed instrument and structured scoring | Medium–high — licensing, Gallup support, annual admin | Research-backed driver diagnostics and benchmarking | Strategic engagement programs, leadership development | Validated, actionable drivers tied to business outcomes |
360-Degree Feedback | High — multi-rater design, anonymity, calibration | High — time-heavy, facilitators, coaching and analysis | Detailed behavioral insights; development and promotion inputs | Leadership development, coaching, promotion decisions | Comprehensive perspective; reveals blind spots |
Stay Interviews | Medium — one-on-one semi-structured interviews | Medium — HR/manager time, skilled interviewers, analysis | Rich qualitative retention insights and targeted actions | Retaining high performers, preempting attrition | Deep, actionable retention drivers; builds trust |
Absenteeism & Presenteeism Metrics | Low — data tracking but needs contextualization | Low–medium — HRIS, attendance tracking, analytics | Objective cost and productivity impact; early warnings | Operational monitoring, cost-focused interventions | Quantifiable financial impact; objective behavioral data |
Turnover & Retention Analytics | Medium — cohort analysis and predictive modeling | Medium–high — analytics capability, exit data, HRIS | Direct retention metrics, ROI for interventions, risk identification | Workforce planning, manager performance assessment | Direct link to financials; predictive and actionable |
Focus Groups & Engagement Workshops | Medium–high — facilitation, sampling, analysis | High — facilitators, time, transcription, synthesis | Deep contextual insights; co-created solutions and themes | Root-cause exploration, program design, culture change | Rich qualitative context and employee buy-in |
So, Where Do You Go From Here?
We’ve just walked through eight ways to measure staff engagement, from a quick eNPS survey to a deep-dive stay interview. It can feel like a lot. If you’re staring at this list looking for a magic formula, let me save you some time. There isn’t one.
Here’s the thing about measurement: the goal isn’t a perfect score. It's about starting a better conversation. Each of these tools is just a way to ask better questions and, more importantly, to listen more carefully.
The numbers are just the starting point. They are the breadcrumbs that lead you to the real story.
The Data Tells You Where to Look
The biggest mistake we see is treating this like a reporting exercise. Leaders collect data, put it in a tidy deck, and file it away. The number becomes the end goal, not the means. This misses the entire point.
A high eNPS score is nice, but the real gold is understanding why your promoters feel that way. A low score isn't a failure; it’s an invitation to dig into the "why" behind the feedback. A low turnover rate is great, but a single stay interview can reveal the unspoken frustrations that might one day make a key person leave.
The data tells you where the smoke is. The conversations with your people are how you find the fire. Don’t just admire the smoke.
In our experience, combining quantitative and qualitative measures gives you the clearest picture. A simple, frequent pulse survey tells you what is happening. It’s the early warning system. Deeper, qualitative conversations like stay interviews or focus groups tell you why it's happening.
This blend is where the magic lies. The data points you in the right direction, and the human conversations give you the context that no chart can ever capture.
Start Small, Start Now
Don't feel overwhelmed. You don't need to implement all eight of these staff engagement measures tomorrow. In fact, you shouldn't. That’s like trying to listen to eight conversations at once. You'll just get noise.
Instead, pick one. Just one.
Maybe you start with a simple eNPS question. Or perhaps you commit to two stay interviews this month. The specific tool matters less than the commitment to a simple, powerful loop:
Ask a question.
Listen to the answer. Really listen.
Do something about it. This is the most crucial step.
That’s it. That’s the whole process. This simple loop, repeated over and over, is the real secret to building genuine engagement. It shows your team that their voice matters not just because you’re listening, but because you’re acting.
This isn't a project with a start and an end date. It's the daily work of building a company where people feel seen, heard, and valued. It’s about trading abstract metrics for real connection. So, what will your first question be?
Ready to stop guessing and start listening? Pebb makes it simple to run pulse surveys, gather feedback, and understand what your team is really thinking, all in one place. See how it works at Pebb and start a better conversation with your people today.
